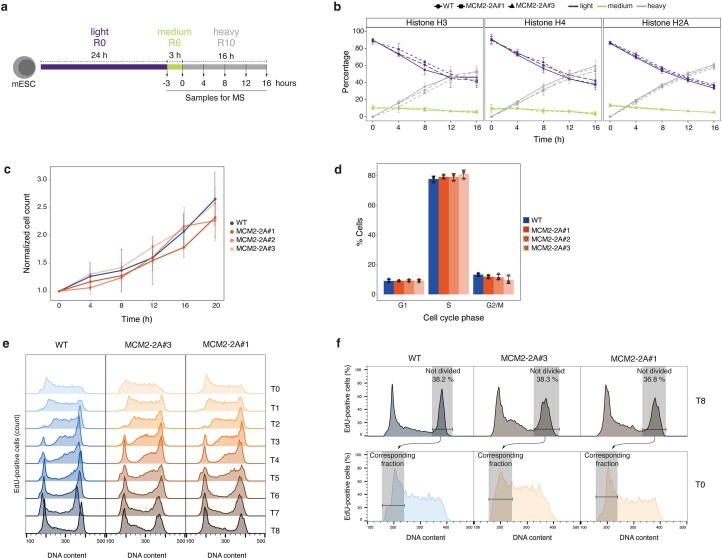
Extended Data Fig. 1. Histone dynamics and cell cycle progression in MCM2-2A mESCs.
a, Experimental setup for pulse-SILAC MS analysis of new histone incorporation and old histone dilution kinetics. b, Relative levels of old histones (purple), new pulse-labeled histones (green) and new steady-state labeled (gray) histones over time. Mean ± s.d. of n = 3 biological replicates is shown. c, Growth curves of WT and three MCM2-2A mESC clones. Cell counts are shown relative to the first time point. Mean ± s.d. of n = 3 biological replicates is shown. d, Cell-cycle analysis of WT and three MCM2-2A clones. The fraction of cells in G1-, S- and G2/M-phase was determined by flow cytometry analysis of DNA content and EdU labeling. Mean ± s.d. of n = 3 biological replicates is shown, dots depict individual data points. e, Flow cytometry analysis showing that cell cycle progression of EdU-labeled cells is similar in WT and two MCM2-2A clones. Cells were pulsed with EdU for 15 min and harvested immediately (T0) or at the indicated time points (T1-T8). Note that most labeled cells have divided at the 8-hour time point. Data are representative of n = 2 biological replicates. f, Quantification of EdU-labeled cells which have not divided at the 8-hour timepoint in e. This represents the cells labeled by EdU in early S.

