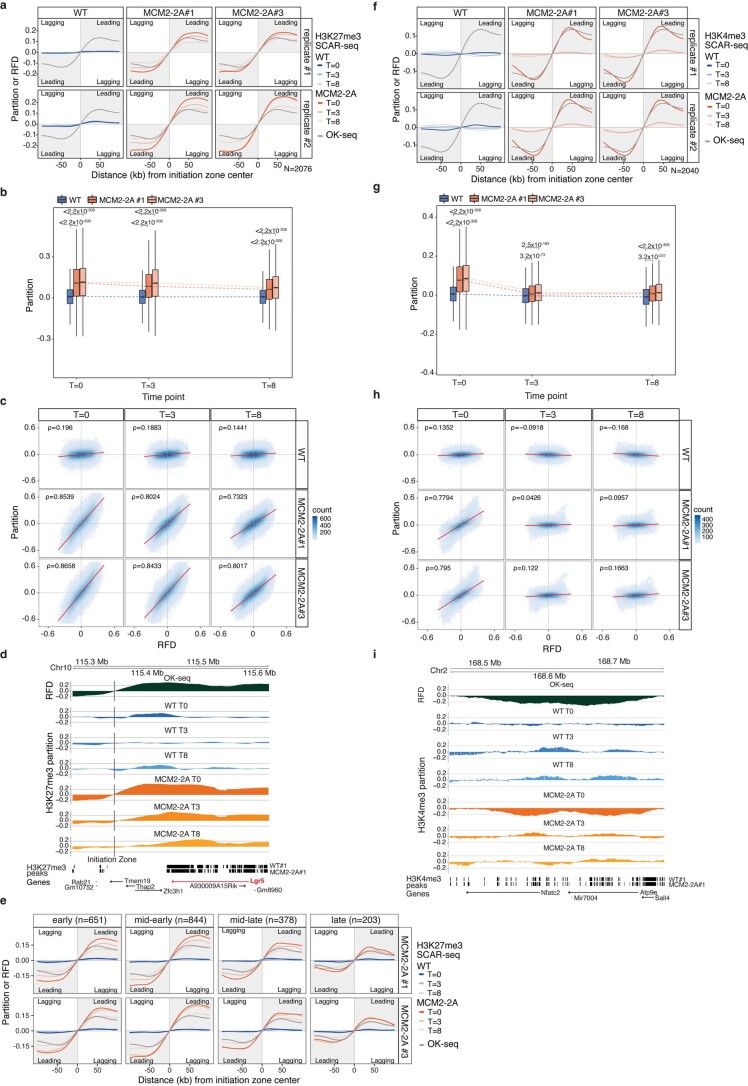
Extended Data Fig. 2. Histone H3K27me3 asymmetry is inherited by MCM2-2A daughter cells, but H3K4me3 asymmetry is rapidly resolved.
a, Individual biological replicates of H3K27me3 SCAR-seq profiles related to Fig. 1c, including two MCM2-2A clones. SCAR-seq is represented as in Fig. 1. b, Box plots of H3K27me3 partition in 1 kb windows around the RFD extrema (distance of 10-90 kb from initiation zones). Windows upstream of initiation zones were multiplied by -1. Box plots as in Fig. 2a. Dashed lines illustrate trends of partition changes over time. Significance was tested per time point and replicate between WT and MCM2-2A using two-sided paired Wilcoxon signed-rank test. c, Scatter plots of H3K27me3 SCAR-seq partition and RFD show association between histone segregation and replication fork directionality. Two-sided Spearman’s rank correlation coefficient. d, Example region of H3K27me3 SCAR-seq in WT and MCM2-2A#1 and RFD14 containing a differentially expressed gene (Lgr5; Fig. 4d, Extended Data Fig. 7g). Chr10:115272208-115624981. e, H3K27me3 SCAR-seq profiles separated according to replication timing, showing that asymmetry at T8 is independent of replication timing. As all cells labeled in mid and late S phase have divided at T8 (Extended Data Fig. 1f), asymmetry is transmitted to daughter cells. Average profiles of RFD and H3K27me3 are represented as in Fig. 1. RFD amplitudes and thus also SCAR-seq amplitudes are lower around late compared to early initiation zones due to more heterogenous replication fork progression across the cell population85, but the relative differences between the amplitudes are similar across the replication timing categories. b–e, The average of n = 2 biological replicates is shown for each clone. f, Individual biological replicates of H3K4me3 SCAR-seq related to Fig. 1d, including two MCM2-2A clones. SCAR-seq is shown as in Fig. 1. g, Box plots of H3K4me3 partition in 1 kb windows around the RFD extrema (distance of 10-90 kb from initiation zones) as in b. h, Scatter plots of H3K4me3 SCAR-seq partition and RFD show association between histone segregation and replication fork directionality as in c. i, Example region of H3K4me3 SCAR-seq in WT and MCM2-2A#1 and RFD14 containing a highly expressed pluripotency gene (Sall4). Chr2:168450809-168783596. g-i, The average of n = 2 biological replicates is shown.

