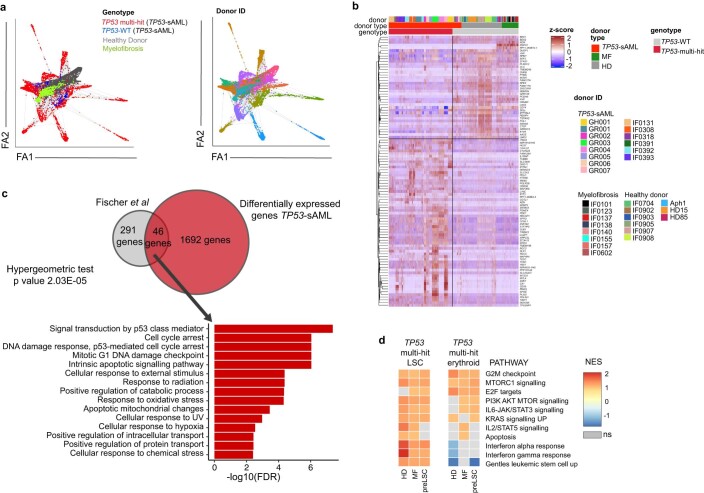
Extended Data Fig. 4. Single cell transcriptomic analysis of healthy donor, MF and TP53-sAML HSPCs.
a, Force-atlas representation of 17517 cells from healthy donor (n = 9), MF (n = 8) and TP53-sAML patients (n = 14; preleukemic: TP53-WT, leukemic: TP53 multi-hit) according to patient type (left) or donor (right). b, Heatmap of the top 100 differentially expressed genes identified between TP53 multi-hit cells and preleukemic (TP53-WT; “preLSCs”), MF and healthy donor (HD) cells. The type of donor, donor ID and TP53 genotype is indicated on the top of the heatmap for each single cell. c, Venn diagram of the overlapping p53-target genes from Fischer et al85 and differentially expressed genes between TP53-multi-hit cells and TP53-WT cells. “p” indicates hypergeometric test p-value. d, GSEA analysis of Lin−CD34+ TP53 multi-hit LSC or erythroid-biased cells (Related to Fig. 2a) from TP53-sAML patients, compared to Lin−CD34+ healthy donor, MF and preLSCs. Heatmap indicates NES from selected genesets with FDR q-value < 0.25. NES: Normalized Enrichment Score; FDR: False Discovery Rate. NS: non-significant.

