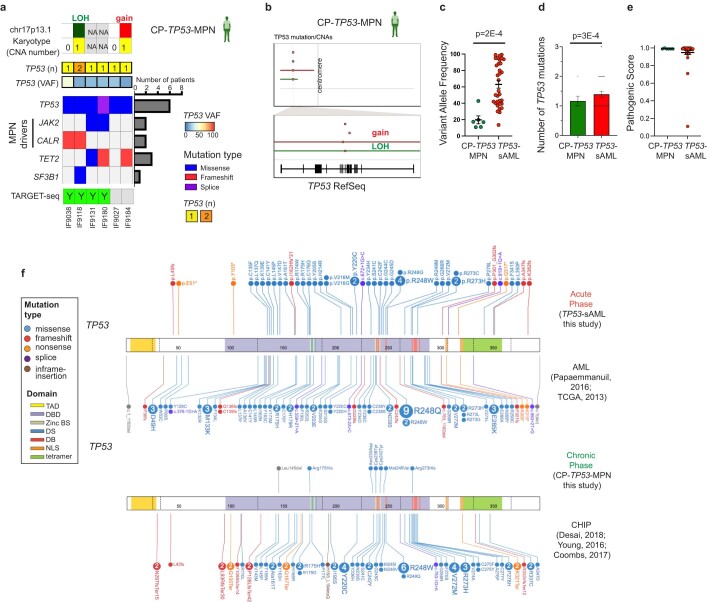
Extended Data Fig. 8. Genetic landscape of chronic phase TP53-mutant MPN.
a, Point mutations and cytogenetic abnormalities identified in a cohort of 6 CP TP53-MPN patients with no evidence of clinical transformation after 4.43 years [2.62-5.94] median follow-up. The number of patients in which each gene is mutated is shown on the barplot on the right and patients processed for TARGET-seq analysis are indicated below the heatmap. b, Summary of CNA events in chr17 and TP53 gene in the 2 CP TP53-MPN patients with detectable CNAs. The top panel shows a whole chromosome view and the bottom one, the gene-level view and RefSeq track. Points indicate the location of each point mutation and solid horizontal lines indicate CNA status. c-e, Comparison of variant allele frequency (c), number of TP53 mutations (d) and pathogenic scores (e) of TP53 variants identified in CP-TP53-MPN (n = 6) and TP53-sAML patients (n = 33). Mean ± s.e.m. is shown; “p” indicates two-tailed Mann-Whitney test p-value. f, Location and mutation type stratified by patient group (chronic/acute phase) as compared to previously published CHIP and AML patient cohorts.

