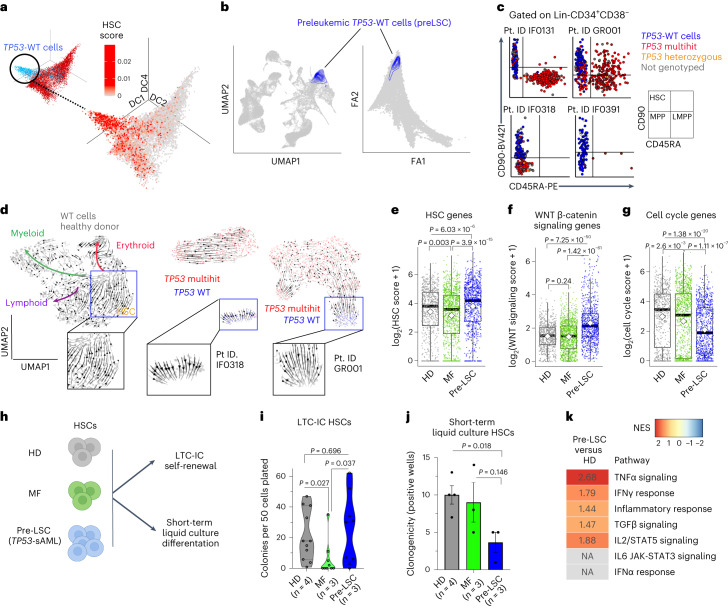
Fig. 3. Molecular and functional analysis of pre-LSCs in TP53-sAML patients.
a, Three-dimensional diffusion map of 8,988 Lin-CD34+ cells from TP53-sAML patients (related to Fig. 2a) colored by expression of an HSC signature (Supplementary Table 3). b, Projection of TP53-WT (n = 880) pre-LSCs on HD (left) and MF (right) hematopoietic hierarchy (related to Fig. 2c and Extended Data Fig. 5d). c, Immunophenotype of Lin-CD34+CD38− cells from four representative sAML patients colored by genotype. Lin-CD34+CD38−CD90+CD45RA− cells (HSCs) were enriched using the sorting strategy outlined in Extended Data Fig. 2a. d, scVelo analysis of differentiation trajectories of Lin-CD34+ cells from one HD (left) and two representative TP53-sAML patients (middle and right). Insets show HSC or pre-LSCs clusters. e–g, Scores of HSC (e), WNT β-catenin signaling (f) and cell-cycle (g) associated transcription in Lin-CD34+CD38− cells from HDs (n = 730 cells), MF (n = 1,106 cells) and pre-LSCs from TP53-sAML patients (n = 880 cells). Boxplots represent the median, first and third quartiles, and whiskers correspond to 1.5 times the interquartile range; the white square indicates the mean for each group. P indicates the Wilcoxon rank sum test P value. h–j, Functional analysis of pre-LSCs. Schematic representation of HSC in vitro assays (h), LTC-IC colony forming unit activity (i) and short-term in vitro liquid culture clonogenicity (j) of HSC from HDs (n = 4), MF (n = 3) and pre-LSCs from TP53-sAML patients (n = 3, samples used (IF0131, IF0391 and GR001) were known to have TP53-WT pre-LSC in the HSC compartment). Violin plot indicates points’ density; dashed lines, median and quartiles, two independent experiments (i); barplot indicates mean ± s.e.m., three independent experiments with 30 colonies plated per experiment (j). P indicates two-tailed t-test P value. k, GSEA analysis of HALLMARK inflammatory pathways in pre-LSCs compared to HDs; positive NES in the heatmap represents significant (FDR q value < 0.25) enrichment in pre-LSCs, values indicate NES for each pathway.

