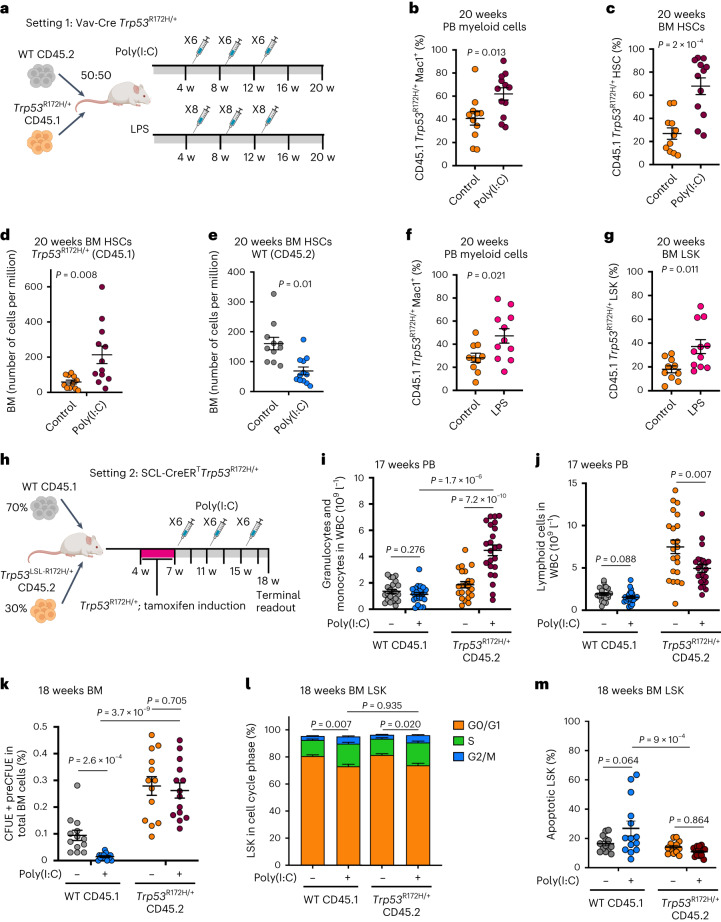
Fig. 5. Inflammation promotes TP53-associated clonal dominance.
a, Experimental design of Vav-iCre WT:Trp53R172H/+ chimera serial poly(I:C) and LPS treatment. b–e, Analysis of chimera mice 20 weeks post-transplantation following three cycles of six poly(I:C) injections. Percentage of CD45.1 Trp53R172H/+ Mac1+ cells in the PB (b) or BM HSCs (Lin-Sca-1+c-Kit+CD150+CD48−; c), number of BM CD45.1 Trp53R172H/+ HSC (d) and CD45.2 WT HSC (e) per million BM cells. n = 11–12 mice per group in two independent experiments and three biological replicates. Mean ± s.e.m. is shown and P indicates a two-tailed unpaired t-test P value. f,g, Analysis of chimera mice 20 weeks post-transplantation following three cycles of eight LPS injections. Percentage of CD45.1 Trp53R172H/+ Mac1+ cells in the PB (f), or BM LSKs (Lin-Sca-1+c-Kit+; g). n = 10–11 mice per group in two independent experiments and two biological replicates. Mean ± s.e.m. is shown and P indicates a two-tailed unpaired t-test P value. h, Experimental design of SCL-Cre-ERT WT:Trp53R172H/+ chimera serial poly(I:C) treatment. i,j, Absolute counts of CD45.1 WT or CD45.2 Trp53R172H/+ granulo-monocytic (Ly6G+ and/or Mac1+; i) and lymphoid (B220+/NK1.1+/CD3+; j) PB cells at 17 weeks post-transplant. k, Percentage of CD45.1 WT or CD45.2 Trp53R172H/+ erythroid progenitors (Lin-Sca-1-c-Kit+CD41−FcgRII/III−CD105+) in total BM MNC at 18 weeks post-transplant. n = 22 control, n = 23 poly(I:C) groups (i, j) or n = 13 control, n = 14 poly(I:C) groups (k) from two independent experiments. Bars indicate mean ± s.e.m. and P indicates two-tailed unpaired t-test P value. l,m, Analysis of cell cycle (l) and apoptosis (m) in BM LSK cells from chimeric mice 18 weeks post-transplantation following three cycles of six poly(I:C) injections as in h. n = 13 control, n = 17 poly(I:C) groups (l) or n = 13 control, n = 14 poly(I:C) groups (m) from two independent experiments, mean ± s.e.m. is shown and P indicates adjusted P value from one-way Anova (in l, the P value was calculated using G0/G1 cell cycle phase).

