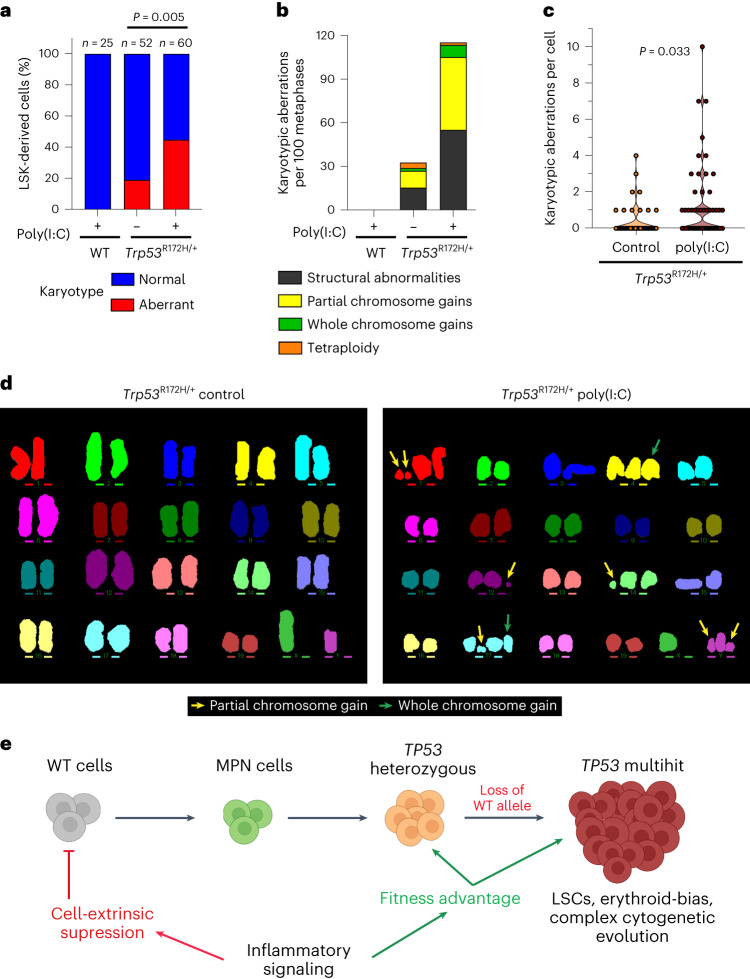
Fig. 6. Inflammation leads to genetic instability in Trp53-mutant cells.
a–d, M-FISH karyotype analysis of LSK-derived cultured cells from CD45.1 (Trp53R172H/+) or CD45.2 (WT) LSKs obtained at terminal end-point from chimeric control or poly(I:C) treated mice as in Fig. 5a (n = 3 mice per group, n = 2 independent experiments). a, Percentage of normal and abnormal karyotypes in each experimental group. At the top of each bar, n indicates number of metaphases scored. b, Type of karyotypic aberrations per hundred metaphases. c, Violin plot of the number of karyotypic aberrations per single Trp53R172H/+ cell stratified by treatment. d, Representative karyotypes from Trp53R172H/+ cells obtained from control or poly(I:C) chimeras (yellow arrows indicate partial chromosome gains and green arrows indicate whole chromosome gains). Two-sided Fisher’s exact test was carried out to calculate P values; in c, Fisher’s exact test was calculated by testing metaphases with 3 or more aberrations versus metaphases with 0–2 aberrations. e, Schematic of the proposed model of TP53-mutant-driven transformation in MPN. Created with BioRender.com.

