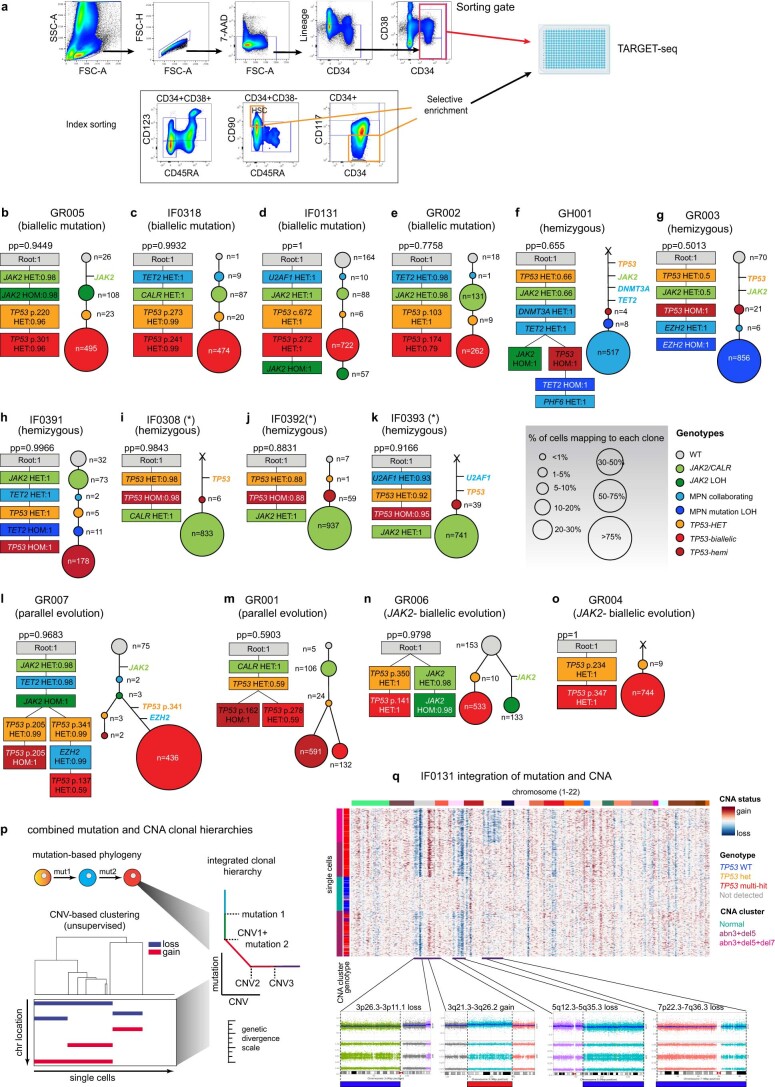
Extended Data Fig. 2. TARGET-seq sorting strategy and phylogenetic reconstruction of clonal hierarchies in TP53-sAML patients using a Bayesian model.
a, Sorting strategy for TARGET-seq: Lineage-CD34+ cells were sorted into 384-well plates for subsequent library preparation. Selective enrichment of immunophenotypically defined populations (HSC: CD38−CD90+CD45RA−; CD117−) is indicated with orange boxes. b-o, In each panel, corresponding to a different patient sample, the phylogenetic tree computed using SCITE is shown on the left and the number of cells mapping to each clone on the right. “pp” indicates the posterior probability of each consensus mutation tree, and the probability of each genotype transition is indicated inside each square for each mutation. The size of the circles is proportional to the size of each clone and is colored according to the genotype indicated. The number of cells mapping to each clone is indicated in each circle and the type of TP53 clonal evolution (biallelic mutation, hemizygous, parallel or JAK2-negative) below each patient’s ID. (*) indicates patients for which the high clonality of the sample prevented the faithful reconstruction of the order of mutation acquisition. Horizontal lines indicate mutation acquisition where none of the experimentally-detected clones matched that particular combination of mutations and therefore the order of mutations cannot be reliably determined. Due to selective enrichment of certain subpopulations of cells (a), the numbers of cells assigned to each subclone in this figure is not necessarily representative of overall clonal burden, and early clones are likely over-represented due to selective enrichment of preleukemic HSCs. In contrast, the relative subclone percentages displayed in Fig. 1 for the same patients have been corrected according to each populations’ frequency in the Lin−CD34+ compartment. p, Schematic representation of the strategy to reconstruct integrated clonal hierarchies based on single-cell TARGET-seq genotyping and inferCNV transcriptomic-based CNAs. q, Representative example of combined mutation and CNA hierarchies for patient IF0131, in which three cytogenetically-distinct subclones were detected. Corresponding cytogenetic lesions detected at the bulk level through high-density SNP arrays are shown in the bottom panels.

