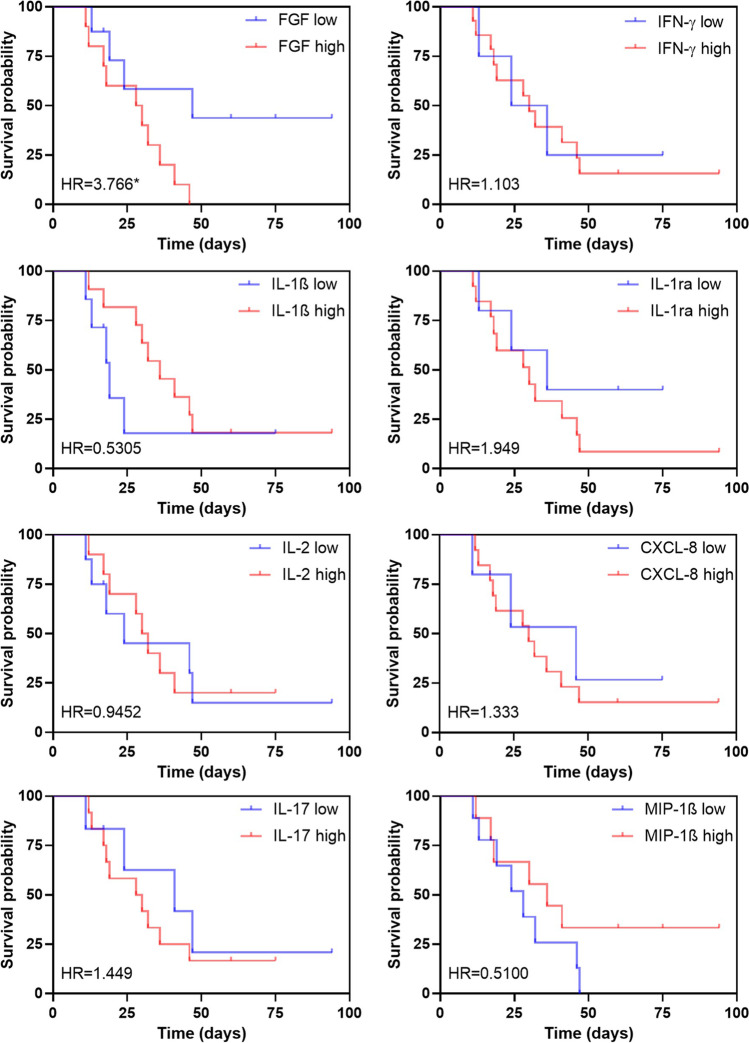
Fig. 3.
Survival curves based on the increased levels of cytokines, chemokine, and growth factor in patients with COVID-19 and candiduria. Cox regression model showing overall survival with hazard ratio (HR) for each mediator if high (red) or low (blue). The * represents the significant result (p < 0.05)

