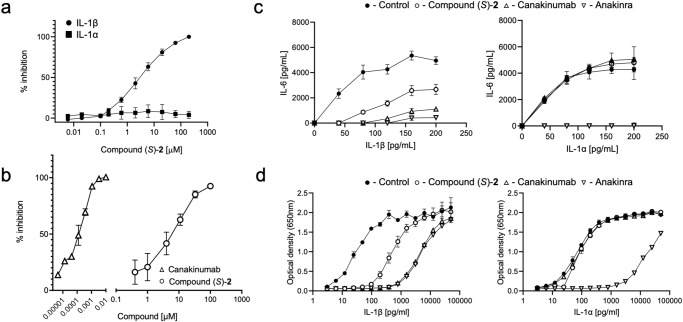
Fig. 3. Compound (S)-2 is a specific antagonist of the hIL-1β /IL-1R1 interaction.
a TR-FRET assay using recombinant hIL-1α (filled squares) or hIL-1β (filled circles) in the absence (control, 100%) or presence of graded concentrations of compound (S)-2 (IL-1α, N = 2; IL-1β, N = 5). b IL-6 release in fibroblasts stimulated with 30 pg/ml IL-1β for 6 h in the presence of a concentration range of canakinumab (open triangles) or compound (S)-2 (open circles); data are presented as % of maximal inhibition of IL-6 release (N = 3). c IL-6 release by human fibroblasts stimulated with graded concentrations of hIL-1β (left panel) or hIL-1α (right panel), in the absence (filled circles, control) or presence of 50 μM compound (S)-2 (empty circles), 3 nM canakinumab (upward triangles), or 3 nM anakinra (downward triangle) (N = 5). d Reporter gene assay in HEK293 cells stimulated and treated as described in (c); hIL-1β (left panel), hIL-1α (right panel) (N = 3). Representative data are shown as mean ± SD; measurements were taken from distinct samples; full data are recapitulated in Table 1. Source data are provided as a Source Data file.

