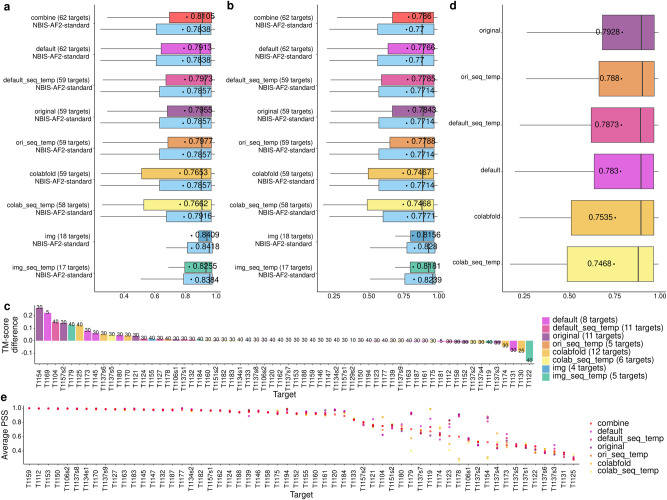
Fig. 2. In-depth analysis of the sampling methods.
a The comparison between the TM-scores of the best models generated by each MSA and template sampling method and the NBIS-AF2-standard on the common full-length targets. The per-target mean (or median) TM-score of each sampling method and the NBIS-AF2-standard is located and reported by the black dot in the box (or located by a vertical line). b The comparison between the TM-scores of the top1 (rank1) models generated by each MSA and template sampling method and the NBIS-AF2-standard on the common full-length targets. The per-target mean (or median) TM-score of each sampling method and the NBIS-AF2-standard is located and reported by the black dot in the box (or located by a vertical line). c The TM-score difference between the top1 model selected by AlphaFold2 pLDDT score in combine are plotted against the top1 model of the NBIS-AF2-standard. The number of models in the combine are specified near the boxes for each target. d The comparison between the TM-scores of the top1 models generated by original, ori_seq_temp, default_seq_temp, default, colabfold and colab_seq_temp on the common 58 full-length targets ordered by the average top1 TM-scores. The per-target mean (or median) TM-score of each sampling method is located and reported by the black dot in the box (or located by a vertical line). e The average pairwise similarity score (PSS) of models from combine, default, default_seq_temp, original, ori_seq_temp, colabfold and colab_seq_temp on each of the 58 common targets. If the average PSS values are almost the same, the dots denoting the values for a target overlap. In this case, the average PSS of the models from combine (red dot) is plotted on the top covering the other dots denoting the almost same values.

