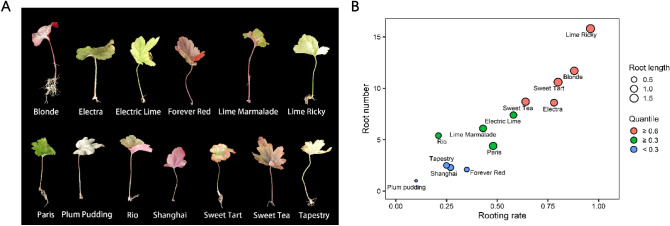
Figure 1.
Rooting responses of different cultivars to leaf cutting after 50 days of growth. (A) Rooting status of each cultivar after cutting. (B) Dot plot illustrating the index for each cultivar and its leaf cutting regeneration potential. The distribution of points from the bottom left to the top right indicates increasing regeneration potential. The dot color represents the quantile calculated based on root number, length, and rooting rate.

