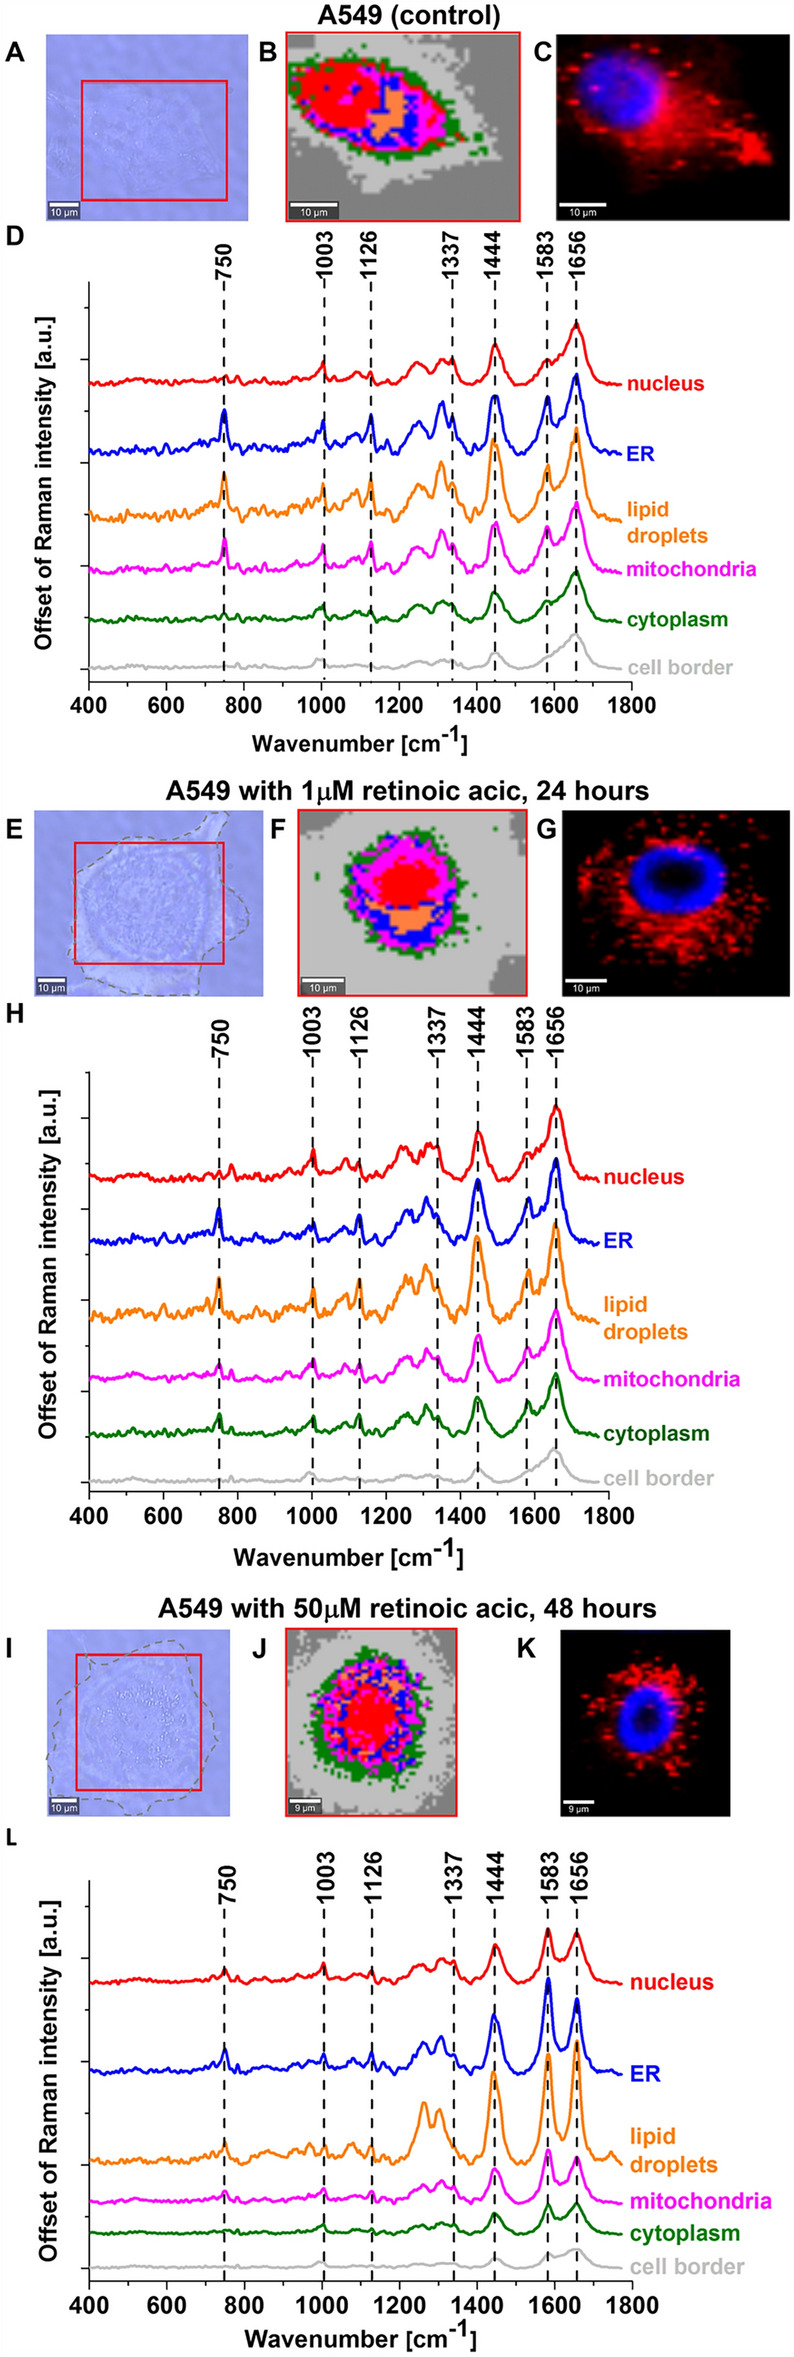
Figure 8.

Raman imaging of lung cancer cells (A549) control and supplemented with 1 and 50 μM retinoic acid by 24 and 48 h. (A, E, I) Microscopy images, (B, F, J) Raman images with respective Raman spectra (D, H, L) of a nucleus (red), lipid droplets (orange), endoplasmic reticulum (blue), cytoplasm (green), mitochondria (magenta), cell border (light grey) and fluorescence images (C, G, K) (nucleus (blue, Hoechst 33,342), lipid-rich organelles (red, Oil Red O). Resolution of images 1 μm, integration time 0.3 s, 10 mW at 532 nm for Raman imaging.
