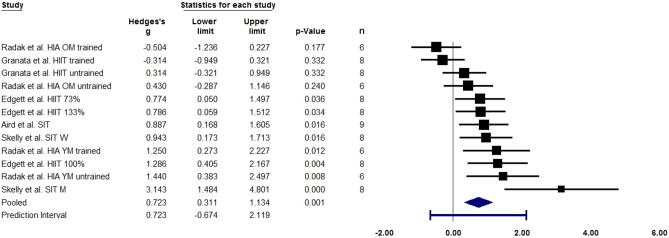
Figure 2.
Forest plot quantifying skeletal muscle SIRT1 gene expression (measured via qPCR or RT-PCR) following a single bout of high-intensity exercise. Adjusted standardised mean difference (Hedges’ g), relative weight of each acute study response, confidence interval (diamond), and prediction interval (blue line) are also shown. HIA high-intensity aerobic, HIIT high-intensity interval training, OM old men, M men, SIT sprint interval training, W women, YM young men. Percentages denote proportion of exercise intensity. n = sample size.

