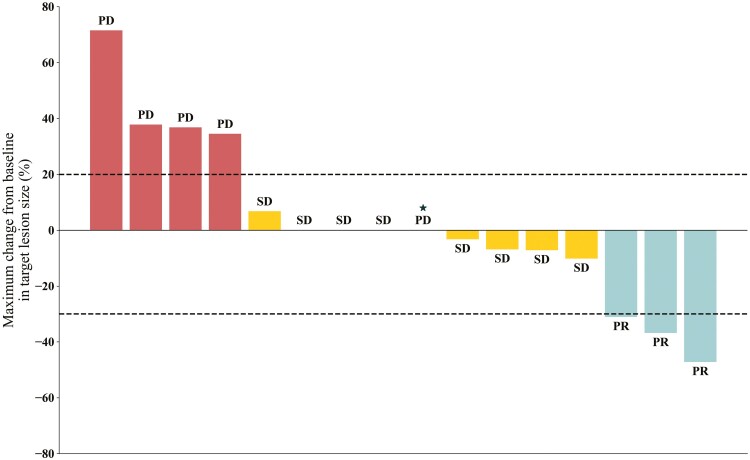
Figure 2.
Waterfall plots of best percentage changes in the sum of the longest diameters of target lesions in phase II cohort (PD, progressive disease; PR, partial response; SD, stable disease). *In this case, there was no change in the target lesion, but a new lesion occurred, so it was judged as PD in the overall response evaluation.

