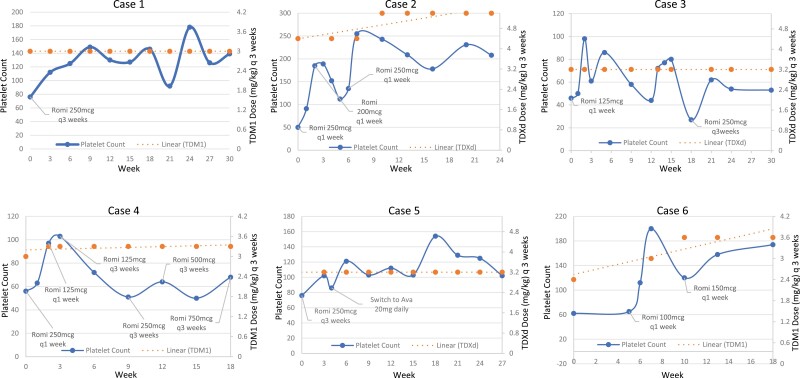
Figure 1.
Platelet count plotted against weeks on therapy of TDM1 or TDXd. The solid blue line represents the platelet count, while the orange hashed line represents the trendline of the respective therapy and orange points are the interval at which T-DM1 or T-DXd were administered. Growth factor was initiated on marked time points on the abscissa, platelet counts at initiation of growth factor is shown on ordinate and week 0 on abscissa. TDM1: trastuzumab emtansine. TDXd, trastuzumab deruxtecan; Romi, romiplostim; Ava, avatrombopag; q3 weeks, every 3 weeks; mcg, micrograms; mg, milligram; kg, kilogram.

