Abstract
Dental plaque biofilm is a complex ecosystem. The distribution of microbial species in the biofilm is heavily influenced by local chemical interactions that result from diverse metabolic activities and the nature of the released molecules. As a relevant example, H2O2-producing bacteria can antagonize disease-associated bacteria, leading to the maintenance of a healthy oral microbiome. Herein, we report the development of a triple-sensor (redox, pH, and H2O2) scanning electrochemical microscopy (SECM) tip capable of simultaneously mapping the pH and H2O2 concentration produced by a dental plaque-derived multispecies biofilm grown on hydroxyapatite. The pH sensor of the triple SECM tip showed a near Nernstian slope of −71.1 ± 2 mV/pH (N = 3), whereas the H2O2 sensor showed a slope of −0.052 ± 0.002 nA/μM H2O2 at pH 7.2 and a detection limit of 1.0 ± 0.2 μM (N = 7). There is no significant difference in the sensitivities of H2O2 sensors at pH 6.2, 7.2, and 8.2 at 95% CI (N = 7). The pH and H2O2 sensors demonstrated excellent reversibility with response times of 3 and 5 s, respectively, along with reliable stability over 4 h at 37 °C. The sensors did not show any cross talk between pH and H2O2 concentration ([H2O2]) measurements, highlighting the accuracy and versatility of the SECM tip. Simultaneous chemical imaging of pH and [H2O2] across the biofilm revealed a clustered distribution of local H2O2 concentrations, ranging from 0 to 17 μM. Conversely, the local pH remained constant at 7.2. The relation of local chemical profiles and the distribution of bacterial species within the oral microbiome was experimentally investigated in the context of bacterial H2O2 antagonism. The benefit of clustered H2O2 production was that the total area of H2O2 produced by smaller clusters was 67% more than that of a single cluster with the same starting number of bacteria. Thus, this triple SECM tip can potentially be used to study local molecular mechanisms that result in dysbiosis of the oral microbiome.
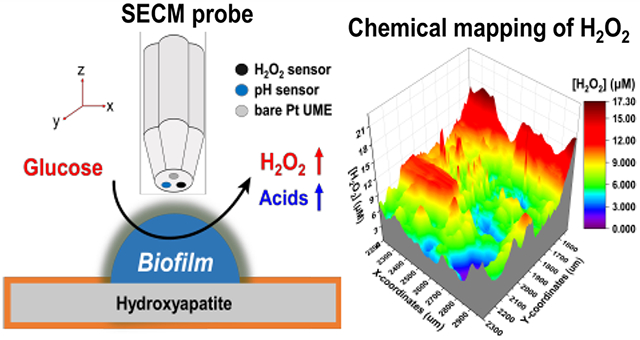
Graphical Abstract
INTRODUCTION
Dental plaque biofilms have been extensively investigated, and the polymicrobial community that resides in biofilm has been characterized genetically, biochemically, and biophysically.1-5 The development of dental plaque biofilms follows a clear spatial and temporal pattern that is genetically determined. Traditionally, the development of dental plaque biofilm was thought to commence with initial colonizers able to interact with salivary proteins and other components that are associated with the tooth enamel surface, called the acquired salivary pellicle.6-9 The traditional view of dental plaque biofilm development was mostly supported by in vitro experiments10-15 with few exceptions.16-23 Recent research has shown that preformed microbial clusters consisting of multiple species present in saliva might play an important role in in situ biofilm development of human dental plaque.24 Interestingly, the settled aggregates were able to initiate growth much better after attachment than were single cells; thus, clusters are more likely responsible for overall proliferation of the biofilm. Although it is currently unknown why proliferation and expansion in dental plaque biofilms might be driven by clusters, it is conceivable that the microenvironment has a determining role in this process because it clearly distinguishes single cells from clusters. Processes such as quorum sensing-dependent communication and related gene expression patterns could be active in polymicrobial clusters, thus already priming these cells for a biofilm lifestyle.25-27 Furthermore, metabolic codependencies might be already shaping the initial species composition of clusters. One specific example is the secretion of lactic acid by oral streptococci. Lactic acid is an important carbohydrate source for Veillonella sp.;28,29 thus, their initial association in microbial clusters creates a suitable microenvironment for biofilm development.
In multispecies oral biofilms, major acid-producing species (such as Streptococcus mutans, Lactobacillus ssp) are responsible for producing a wide variety of organic acids, including lactic acid, which titrate the local microenvironment surrounding the bacterial species and ultimately change the local pH to acidic. This local acidic pH gradient might interact with the major H2O2-producing species (such as Streptococcus gordonii and Streptococcus sanguinis) present within these multispecies biofilms. These interactions between two chemical profiles, such as pH and H2O2, ultimately contribute to the overall health of the biofilm. From our previous SECM-based studies,30 it has been observed that the H2O2-producing capacity of S. gordonii is suppressed when it is exposed to an acidic profile (pH < 6.0) produced by S. mutans. Although it is an important finding, further exploration is needed in the context of a multispecies biofilm, that is, to determine whether similar trends exist in a multispecies setting. The first step toward the elucidation of this complex real-time metabolic profile interaction is to quantitatively map the H2O2-producing capabilities of the major beneficial species across the biofilm and how this H2O2 chemical profile is distributed in multispecies biofilm while knowing the exact local pH distribution in parallel. To address this analytical challenge, a specialized SECM tip is required to quantitatively map the local H2O2 producing zones above a multispecies biofilm while simultaneously mapping the local pH. Several SECM studies have reported the mapping of pH and H2O2 on live biofilms.30-33 There are reports on a multifunctional dual SECM probe for simultaneous mapping of topography and electrochemical imaging,34-38 but so far none has reported the simultaneous mapping of pH and H2O2 using a triple SECM tip above live biofilms. Henceforth, in this study, we designed and developed a triple SECM tip capable of measuring pH and H2O2 at the same time while the bare Pt UME is able to perform the approach curve to determine the tip–substrate distance and morphological characteristics of the dental plaque-derived biofilm.
MATERIALS AND METHODS
Chemicals and Materials.
Iridium(IV) chloride (IrCl4), lead acetate (PbAc2), and carboxymethylcellulose sodium salt were purchased from Alfa Aesar (Ward Hill, MA, USA). Oxalic acid dihydrate, anhydrous potassium carbonate (K2CO3), and lactic acid were purchased from EMD Millipore (Burlington, MA, USA). Chloroplatinic acid hexahydrate (IV) (H2PtCl4.6H2O) was purchased from Sigma-Aldrich (St. Louis, MO, USA). Ferrocenemethanol (FcMeOH) and sucrose were purchased from TCI America (Portland, OR, USA) and J.T. Baker (Phillipsburg, NJ, USA), respectively. d-Glucose, 30% hydrogen peroxide, hydrochloric acid (HCl), and calcium chloride dihydrate (CaCl2.2H2O) were purchased from Macron (Center Valley, PA, USA). Difco tryptone was purchased from Life Technologies Corp. (Detroit, MI, USA), and yeast extract was purchased from MP Biochemicals (Solon, OH, USA). Protease peptone was purchased from Hardy Diagnostics (Santa Maria, CA, USA).
Triple-barrel glass capillaries (Figure 1A) were purchased from WPI (Sarasota, FL, USA), and 25 μm of Pt wires were from Goodfellow Cambridge Ltd. (Huntingdon, England). Microsized alumina powder and polishing pad and cloth were purchased from Buehler (Lake Bluff, IL, USA).
Figure 1.
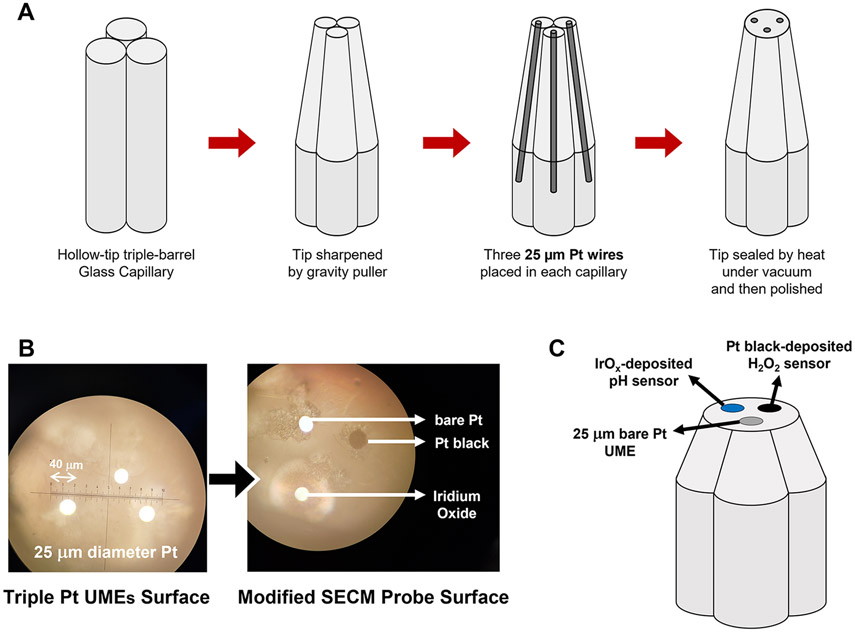
(A) Schematic of the fabrication of the SECM probe tip with three Pt ultramicroelectrodes. (B) Optical microscopy image of the surface of the tip before and after modification to H2O2 and pH sensors. (C) Schematic diagram of the tip surface after being modified electrochemically.
Artificial saliva (AS) solution was prepared by adding 0.70 mM CaCl2, 0.43 mM MgCl2, 4 mM NaH2PO4, 10 mM HEPES, and 30 mM KCl to deionized (DI) water. The final pH of the AS solution was adjusted to 7.2 with 3.0 M HCl and/or 3.0 M NaOH. Ultrapure water was used to prepare all solutions used.
Basal medium mucin (BMM) was prepared by mixing 10 g of protease peptone, 8 g of carboxymethylcellulose, 5 g of BBL trypticase peptone, 5 g of yeast extract, and 2.5 g of KCl in 1.0 L of Milli-Q water, followed by autoclaving for 15 min at 120 °C.
Instrumentation.
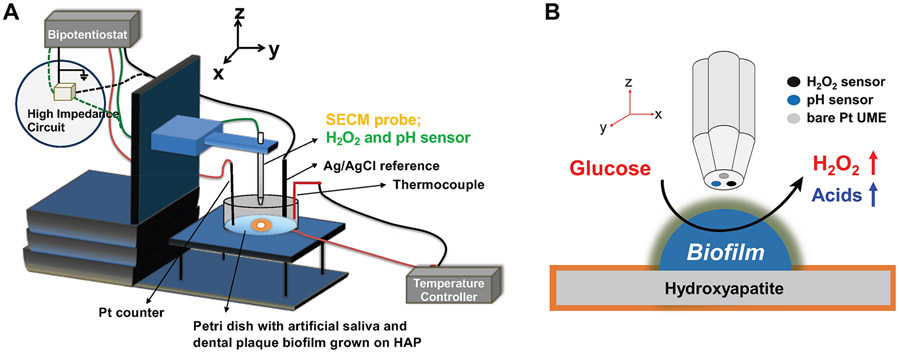
All amperometric measurements were performed with a CHI bipotentiostat and a SECM (model no. 920D, CH Instruments, Austin, TX, USA). A 0.5 mm Pt wire worked as a counter electrode, and Ag/AgCl (in 1 M KCl) was used as a reference electrode. A high-impedance potentiometer (model no. 301, Lawson Laboratories, Malvern, PA, USA) was used for all potentiometric measurements. For all fluorescence imaging, confocal laser scanning microscopy (CLSM) (model no. LSM 780 NLO, Zeiss, Oberkochen, Germany) was performed.
Fabrication of Triple-Sensor SECM Tip.
The triple-barrel glass capillaries were washed with ethanol and dried in an oven at 80 °C for 10 min. They were then pulled by a gravity puller (model no. P-30, Sutter Instrument, Novato, CA, USA) to obtain a sharp taper (Figure 1A). Later, 1.0 cm of three 25 μm diameter Pt wires was inserted, sealed, and then polished to expose the electrode surface to make a triple SECM tip. Figure 1B represents the polished Pt UME and its modified surfaces under optical microscopy. The fabricated SECM tip had three exposed 25 μm diameter Pt electrodes, two of which were modified to construct a pH sensor and an H2O2 sensor (Figure 1C). The pH sensor was prepared by electrochemically depositing iridium oxide (IrOx) on one of the three platinum electrodes of the SECM tip.39 In brief, 15 mg of IrCl4·xH2O was dissolved in 10 mL of DI water and then stirred for ~10 min. A 100 μL hydrogen peroxide solution (30%) was added dropwise and continued for another 10 min of stirring. Then, 73 mg of potassium oxalate hydrate was added and stirred for an additional 10 min. The pH of the solution was raised to pH 10.5 by adding anhydrous potassium carbonate and then allowed to stand for ~2–3 days at room temperature. The iridium oxalate color changes from yellow to blue after incubating for ~2–3 days. The electrochemical deposition of IrOx on the SECM tip was performed by CV from 0 to 0.75 V (vs Ag/AgCl). The electrodeposition of the IrOx thin film was controlled by controlling the number of cycles of CV. The electrochemically deposited IrOx on the SECM tip was washed with DI water followed by air-drying.
Later, another UME surface of the same triple SECM tip was modified with Pt black to function as an H2O2 sensor. The Pt black deposition solution was prepared by adding 3 w/v% chloroplatinic acid and 1 w/v% PbAc2 to Milli-Q water. The Pt black was electrodeposited using an amperometry method at −0.2 V (vs Ag/AgCl). (Figure 1B and C). The Pt black deposition was controlled by controlling the deposition charge for reproducibility. This fabricated SECM tip was then cured overnight in AS at pH 5.5 and calibrated the next day before performing SECM.
The triple-barrel SECM tip fabrication steps are very delicate especially during the vacuum sealing and polishing stage. Our research group has a success rate of approximately 90% for tip fabrication.
Electrochemical Characterization of pH- and H2O2-Sensing SECM Tip.
The SECM tips were calibrated before and after use in SECM experiments (pre- and postcalibration). The pH sensor was calibrated in AS from pH 9.0 to 5.0. The H2O2 sensor was also calibrated in the range from 0.1 to 120 μM H2O2 by using the standard addition method into AS. The response time of each sensor was measured according to the definition of IUPAC by using the standard addition method into AS.
Dental Plaque-Derived Multispecies Biofilm Growth Setup.
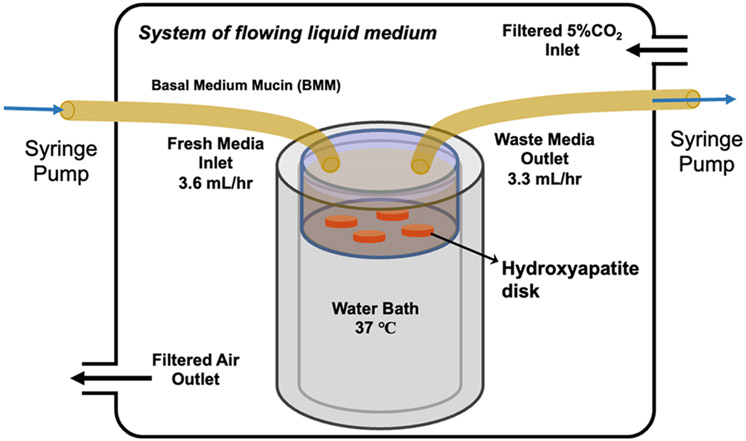
As shown in Figure 2, the multispecies biofilm derived from dental plaque was grown inside a custom-built incubator system. The incubator is fitted with sensors to monitor the solution temperature and the humidity level inside the incubator at all times. The hydroxyapatite (HAP) disk was initially polished with 1500 grit sandpaper and then washed with DI water and 70% ethanol. After drying, the HAP disk was covered with Kapton tape to obtain an exposed area of 1.5 mm in diameter. The disk was then placed in a Petri dish and UV-sterilized in a biosafety cabinet. The exposed area of HAP was coated with human saliva filtered with a 0.2 mm syringe and left inside the biosafety cabinet to dry. All items were sterilized before being introduced inside the sterile incubator. Dental plaque was obtained from human subjects following a strict protocol approved by the IRB office of the University (protocol: STUDY00018963: Manipulation of Bacterial Metabolism: A New Approach to Develop Smart Dental Composites - OHSU). Subsequently, dental plaque was suspended in a phosphate-buffered saline (PBS) solution and then inoculated inside the Petri dish containing BMM. Fresh BMM was continuously pumped through the Petri dish with a syringe pump. The bacteria were fed three times to simulate the human eating behavior pattern. Biofilm samples were grown inside this incubator at 37 °C for 14 days in 5% CO2 balanced with an air–gas mixture.
Figure 2.
Schematic of the incubator system setup for the growth of dental plaque biofilm in an environment that is similar to that of the human mouth. The system includes the flowing liquid media to emulate salivary flow at a 3.6 mL/h flow rate and air composition with 5% CO2 and 20% O2.
3D Mapping of Biofilm Morphology and Simultaneous pH and H2O2 Concentration Profile.
The multispecies biofilm grown on the HAP disk was taken out of the incubator after 14 days and then washed with ice-cold sterile AS and placed on the SECM stage. The calibrated sensor (as described earlier) was attached to the SECM holder along with the Ag/AgCl reference electrode and Pt wire as the counter electrode. At first, we performed the negative feedback approach curve on Kapton tape at +0.4 V by using ferrocene methanol as a redox mediator at 23 °C to avoid any unintended interaction with bacterial metabolism. The point on the Kapton tape acted as a point of reference to calculate the biofilm height and morphology. Several x- and y-direction scans were performed on the entire biofilm (1.5 mm diameter) at different Z-distances above the biofilm to estimate the average height and features of the biofilm. Later, a more accurate biofilm morphology (700 μm × 800 μm) was recorded by using the SECM imaging mode.
After the biofilm morphology was recorded, we replaced the solution with fresh AS (pH 7.2), and the heater was turned on to reach 37 °C. Glucose was added to the biofilm, and then, the tip was scanned over the biofilm to obtain a SECM image. Amperometry and potentiometry data were collected simultaneously by using a high-impedance potentiometer. Later, the current (amperometry) and potentials (potentiometry) were converted to H2O2 and pH by using post-SECM experiment calibration curves.
CLSM Imaging with a Fluorescence In Situ Hybridization (FISH) Assay.
The biofilm used in the SECM experiment to investigate its morphology and chemical profile of pH and [H2O2] was fixed in 4% formaldehyde in PBS for 12 h at 4 °C. The following protocol was adopted from the references.16,40 The biofilm was washed with PBS, kept in 50% ethanol (v/v) in a PBS solution, and then kept at 4 °C for 1 h. After incubation, the biofilm sample was rinsed with PBS and again incubated in a solution that included 7 mg/mL of lysozyme, 0.1 M Tris-HCl, and 5 mM EDTA (pH 7.2), for 1 h at 37 °C to permeabilize bacterial cells in the initial biofilm. The sample was then dehydrated by keeping it in a series of 50%, 80%, and 100% ethanol sequentially for 3 min each. Three different types of oligonucleotide probes were used: EUB 338 (Alexa488) for all bacteria, STR 405 (Cy5) for streptococci-specific bacteria, and MIT 447 (Cy3) for streptococci carrying the spxB gene (encoding the pyruvate oxidase, the main H2O2-producing enzyme). We added 60 ng of each oligonucleotide probe dissolved in 60 μL of hybridization buffer (0.9 M NaCl, 20 mM Tris-HCl (pH 7.2), 25% formamide (v/v), and 0.01% sodium dodecyl sulfate (w/v)) to the biofilm sample and incubated it for 2 h at 46 °C. The sample was then washed by incubating in a solution containing 20 mM Tris-HCl (pH 7.5), 5 mM EDTA, 159 mM NaCl, and 0.01% SDS for 20 min at 48 °C. After washing, the labeled biofilm was analyzed by CLSM.
Determination of H2O2 Production and Streptococcus mutans Inhibition on Solid Agar Plates.
The H2O2 producer Streptococcus gordonii DL1 was grown aerobically as a static culture (5% CO2, 37 °C) in brain–heart infusion broth (Difco Bacto, Sparks, MD). To compare the production of H2O2 between a simulated single aggregate and multiple aggregates, we inoculated a single 80 μL aliquot or four separate 20 μL aliquots onto Prussian blue agar plates. The single aliquot was placed in the center of the agar plate, whereas the four separate aliquots were placed in a square-like pattern with sufficient distances from each other. The Prussian blue agar indicator plates for H2O2 production were prepared as described10 and were suitable for the detection of bacterial H2O2 production by the formation of a blue precipitate (Prussian blue, ferric ferrocyanide) in the presence of H2O2. After inoculation, plates were aerobically incubated (5% CO2, 37 °C) for 48 h. H2O2 production was documented by photographing the plates at a fixed distance. The diameter of the blue circle was measured and used to calculate the area (A = πr2). The four separate smaller areas were combined for direct comparison to the single larger area. To determine the inhibition of competitor S. mutans UA159, we basically followed the experimental setup as described for H2O2 production, with the following modifications: Instead of Prussian blue agar plates, regular brain–heart infusion plates were first inoculated with 100 μL of S. mutans overnight culture. Cells were evenly spread on a plate by using a disposable spreader. After the residual liquid dried off, S. gordonii was inoculated, and plates were incubated aerobically (5% CO2, 37 °C) for 48 h. The inhibition zone was measured and used to calculate the area as described earlier.
RESULTS AND DISCUSSION
Electrochemical Characterization of the pH and H2O2 Sensors of the SECM Tip.
The three Pt electrodes in the triple SECM tip were characterized by cyclic voltammetry (in a 0–0.4 V potential window) in 1 mM ferrocene methanol as shown in Figure S1A. The UME showed steady state current (iss) at 0.4 V. Later the approach curve (Figure S1B) on the insulating glass substrate was collected to confirm the suitability of these newly developed triple electrodes as SECM tips. Constant 0.4 V was applied to each UME at 1 mM ferrocene methanol by approaching the tip closer to the glass substrate. The recorded current was converted to Inorm (i/iss) and plotted vs L (d/r), where i is the current, d is the distance between the tip and substrate, and r is the radius of electrode. The experimental negative feedback curves from each UME were overlaid on a theoretical approach curve and showed matching results with the radius of gyration (RG) = 5, as shown in Figure S1B. The theoretical approach curve was based on the axial symmetry of a disk-shaped UME. In our case, even though the SECM tip was a triple-barrel electrode, it was always operated as a single electrode when performing the negative feedback approach curve. That is, one electrode was used as the working electrode, and the other two electrodes were not connected and acted as nonelectroactive surfaces.
To validate the applicability of the negative approach curve for the triple-barrel SECM tip, we performed a negative approach curve and then ran CVs at four different distances above the substrate (19, 25, 50, and 100 μm) and recorded the corresponding steady-state currents (Figure S2). No significant differences in steady-state currents between these two methods were observed. Thus, these results validate that the theoretical approach curve is still valid for the triple-barrel tip.
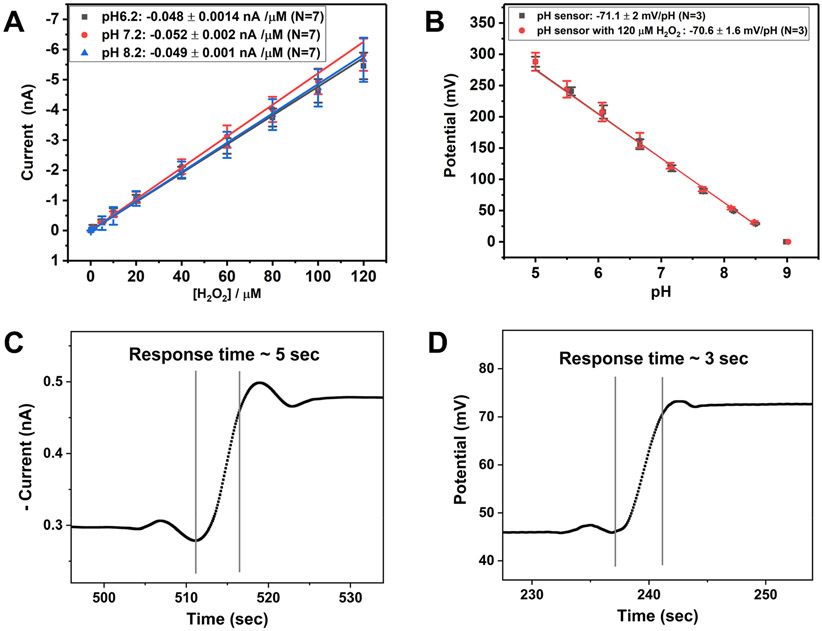
Two of the three electrodes were then modified with Pt black and IrOx to act as H2O2 and pH microsensors, respectively. The sensors were calibrated by using the standard addition method, as shown in Figure 3A. H2O2 sensors showed slopes of −0.048 ± 0.0014, −0.052 ± 0.002, and −0.049 ± 0.001 nA/μM (N = 7) at pH 6.2, 7.2, and 8.2, respectively. There are no significant differences in the sensitivity of the hydrogen peroxide sensor at different pH (6.2, 7.2, and 8.2) at 95% CI. The detection limit of the H2O2 sensor was reported to be 1.0 ± 0.2 μM (N = 7).
Figure 3.
Characterization of the fabricated H2O2 and pH sensors. (A) The calibration plots of H2O2 sensors at different pH (pH 6.2, 7.2, and 8.2). The sensitivity of the H2O2 sensor is measured at +0.5 V (vs Ag/AgCl). The sensitivities of H2O2 sensors are −0.048 ± 0.0014 nA/μM (pH 6.2), −0.052 ± 0.002 nA/μM (pH 7.2), and −0.049 ± 0.001 nA/μM (pH 8.2) (N = 7). The sensitivities of hydrogen peroxide sensors at three different pH (pH 6.2, 7.2, and 8.2) are not significantly different at 95% CI. The responses of the H2O2 sensors show linearity in the range of interest, from 0 to 120 μM. (B) The calibration plot of pH sensors. The sensitivities of pH sensors with and without 120 μM hydrogen peroxide are −70.6 ± 1.6 mV/pH and −71.1 ± 2 mV/pH (N = 3), respectively. There is no significant difference in sensitivities of pH sensors with and without 120 μM H2O2 at 95% CI. (C, D) The response times of the H2O2 and pH sensors were measured by using the IUPAC definition: the time required to reach 90% of the final value from the initial value.
The pH sensor showed the super-Nernstian response of −71.1 ± 2 mV/pH (N = 3) in AS (Figure 3B), as expected for the IrOx-based pH sensor.39 Because of the proximity of the three electrodes in the triple SECM tip, it is essential to study the effect of the H2O2 sensor on the response of the pH sensor. Therefore, we performed the same pH calibration curve in the presence of 120 μM H2O2 in the solution, while +0.5 V was applied to the H2O2 sensor. In this case, we observed that the sensitivity of the pH sensor is −70.6 ± 1.6 mV/pH (N = 3), which is not significantly different from the pH sensor’s sensitivity in the absence of hydrogen peroxide, based on a 95% confidence interval. This observation validates that the pH sensor can function independently in the presence of the working H2O2 sensor. We did not test the stability of the pH sensor above 120 μM H2O2, as we did not anticipate biofilm production of more than 120 μM H2O2.
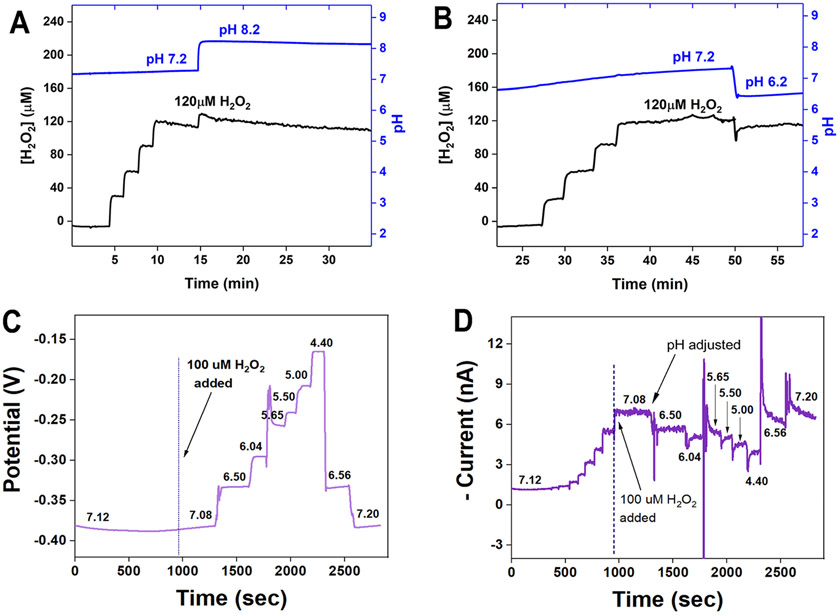
The triple SECM tip was then tested in simulated biofilm experiments, i.e., the H2O2 sensors independently with the change in solution pH from neutral to basic or acidic (Figure 4). Both the H2O2 and the pH sensors were tested for reversibility (Figure 4), as the biofilm could show variation in low and high pH spots and low and high H2O2 concentrations depending on the distribution of the H2O2 or acid/base-producing bacterial species. H2O2 is known to easily decompose at an acidic pH and is more stable in a basic pH environment. We also confirmed this from the results shown in Figure 4D. The [H2O2] decreases with a drop in pH and increases again with the addition of hydroxide. However, this does not affect the interpretation of our results since there was not much change in pH due to the sufficient buffering capacity of the AS to maintain its pH. Further, there is no significant difference in the sensitivities of the hydrogen peroxide sensors with pH variations at 95% CI. Thus, we could monitor pH and H2O2 above the viable biofilm in the experimental setup. In addition, the H2O2 sensors do not show any interfering signals against common organic acids produced by dental plaque biofilms such as 600 μM of lactic acid, 600 μM of citric acid, and 600 μM of acetic acid in the presence of 60 μM of H2O2 at pH 7.2.
Figure 4.
(A, B) Simultaneous measurements of [H2O2] and pH. The pH and H2O2 concentrations were recorded when [H2O2] was added from 0 to 30, 60, 90, and 120 μM, and then, the pH was adjusted from 7.2 to (A) 8.2 and (B) 6.2. There is no pH change during standard addition of H2O2 and no significant [H2O2] change after pH adjustment. (C, D) Reversibility test of pH and H2O2 sensors in a SECM tip. (C) pH calibration after exposure to 100 μM of H2O2. (D) The H2O2 sensor signal changes, depending on the pH solution change.
Furthermore, we conducted a control experiment using a blank (biofilm growth media BMM) and an oral bacterial culture, but we did not detect any redox species within the H2O2 sensor’s working potential window. In a second control experiment, we used an oral bacterial suspension (OD = 1) in PBS (pH 7.2) and performed H2O2 quantification at 37 °C with and without 10 mM glucose feeding. However, no redox species were present due to glucose metabolism by the oral bacteria in the H2O2 sensor’s working potential window. Therefore, detecting the H2O2 concentration in the vicinity of oral biofilm is not affected by any known interferences.
pH and H2O2 Concentration Profile above Multispecies Biofilm.
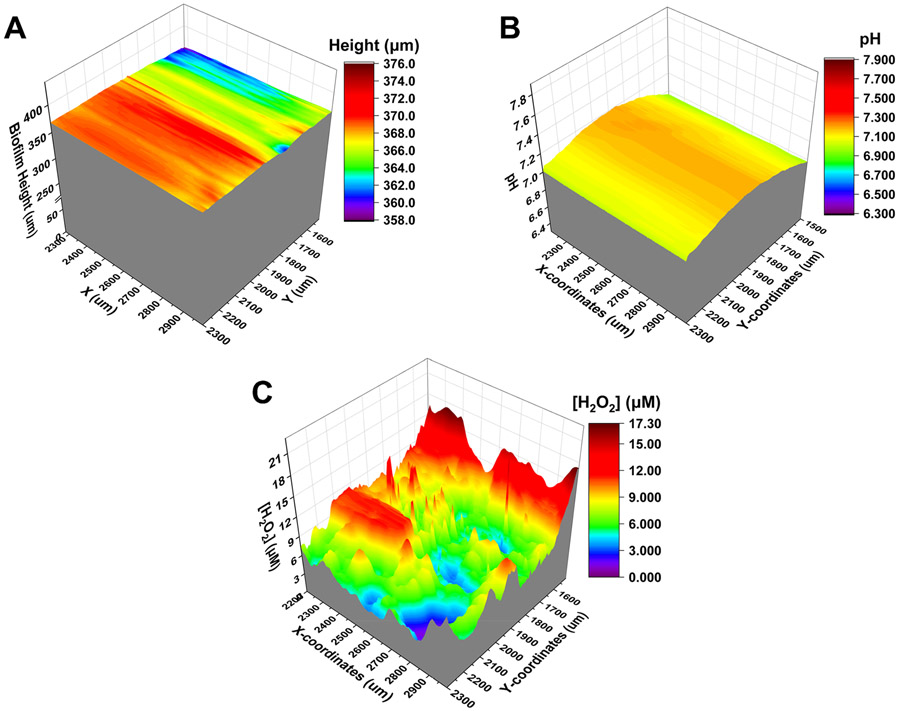
The dental plaque-derived multispecies biofilm grown on the HAP disk was removed from the incubator after 14 days and washed with ice cold sterile AS and placed on the SECM stage, as shown in Figure 5. The calibrated sensor was equipped for SECM instrumentation. We performed the negative feedback approach curve on Kapton tape at +0.4 V in a sterile 1 mM ferrocene methanol solution at 23 °C. The height and features of the biofilm morphology were estimated by obtaining several x- and y-direction scans over biofilm (1.5 mm diameter) at different Z-distances above the biofilm. Once we had the biofilm height profile, the newly developed triple SECM tip was then used to simultaneously map the pH and H2O2 profiles produced by the dental plaque-derived biofilm, as shown in Figure 6B and C, respectively. We observed no changes in pH above the biofilm, which suggests that any organic acids produced by species such as acidogenic S. mutans are present in low concentrations that are not enough to titrate the buffering capacity of the AS surrounding the biofilm and the immediate microenvironment above the biofilm. The biofilm morphology was also recorded (Figure 6A) to deconvolute the morphological characteristics of the chemical imaging data. Although the biofilm was approximately 370 μm thick, the surface topography was devoid of sharp variation in the surface, suggesting a relatively uniform morphology.
Figure 5.
Schematic of SECM experimental setup with an SECM probe tip, including the H2O2 and pH sensors. (A) SECM stage with Petri dish with dental plaque biofilm grown on hydroxyapatite. The dish is filled with the artificial saliva solution, and the tip is immersed in it to control the distance between the tip and the biofilm. (B) The hydroxyapatite was covered with a layer of 40 μm thickness Kapton tape to expose only 1.5 mm diameter of its surface on which dental plaque biofilm grows. The SECM tip was fixed at 20 μm above the mature biofilm and used to map the chemical profiles of H2O2 and pH in 3D.
Figure 6.
(A) SECM image of morphology of dental plaque biofilm grown on hydroxyapatite. The dimension of the mapping area was 700 × 800 μm at the center of the biofilm. (B) pH and (C) H2O2 concentration profiles mapped simultaneously by using the SECM tip on live dental plaque biofilm. The dimension of the mapping area was 800 × 800 μm at the center of the biofilm.
In addition, the H2O2 concentration profile of the multispecies biofilm was determined to be in the range of 0–17 μM. The distribution of the H2O2 profile suggested that H2O2 was not produced uniformly across the biofilm, as expected from a multispecies biofilm. As shown in Figure 6C, there was no homogeneity in terms of H2O2 concentration and the size of H2O2-abundant zones in the mapped area. The surface area for H2O2 concentration ranging from 0 to 5 μM was 107,500 μm2 (16.8%), 404,600 μm2 (63.2%) for a range from 5 to 10 μM, and 127,900 μm2 (20.0%) for a range from 10 to 18 μM, from the scanned SECM image (800 μm × 800 μm). This heterogeneity of the H2O2 concentration micro-profile is driven by the distribution of species, and it can cause a healthy or pathogenic microbiome. We also hypothesized that H2O2-rich regions of larger sizes may represent a larger aggregation of H2O2-generating species. This was confirmed by the fluorescence in situ hybridization assay, as shown in Figure S3.
Previously we reported the pH-dependent interference of H2O2 production.30 Streptococcal H2O2 production was suppressed when the pH changed to acidic conditions below 6.0.30 In this study, the multispecies biofilm did not have enough acid-producing capacity to overcome the titration ability of the AS-based buffer to change the pH. Therefore, we assume that the change in H2O2 production in different parts of the biofilm was solely due to the differential distribution of major H2O2-producing species, such as S. gordonii or S. sanguinis. This is the first time that we have observed a correlation between the spatial distribution of species in viable biofilms and their functions as measured by their metabolic H2O2 output. This observation strongly supports that chemical microenvironments are essential in influencing the distribution of distinct species, thus determining the potential of the oral biofilm to be pathogenic or health supporting.
Colonization of Separate Smaller Areas Might Be Beneficial for Persistent Colonization.
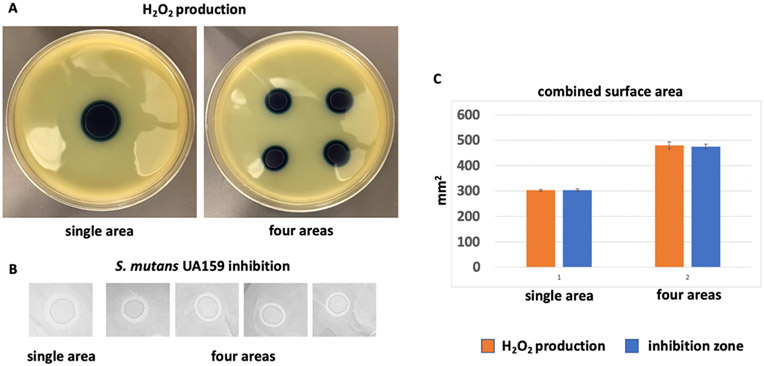
We are interested in the ecological impact of H2O2-producing streptococci on the oral biofilm. Using SECM imaging, we demonstrated that their antagonizing activity toward pathobionts is a function of their distribution. Our observations have shown that the broader distribution of species has the potential to determine the level of oral biofilm health since H2O2 production capacity is considered a major trait of beneficial oral commensals. To confirm that the distribution of H2O2-producing bacteria determines biofilm pathogenicity, we used the well-established semiquantitative Prussian blue (PB)-based assay to measure H2O2 (Figure 7).41,42 The figure displays the area covered by H2O2 produced by the same number of bacteria on both sides. The image on the right, which shows the effect of incubating four different drops of 20 μL of OD600 1.0 S. gordonii (Sg) dispersion, and the image on the left, which displays the effect of an 80 μL drop of OD600 1.0 Sg dispersion, prove that the pathogenicity of biofilms is not only determined by the number of bacteria present but also by their distribution. To understand the ecological consequences of this H2O2 distribution pattern, we simulated early colonization of the same number of bacteria either at a single location or at four separate locations in vitro on H2O2 indicator plates (Figure 7A). Additionally, we conducted an antagonism assay to determine the inhibitory potential of S. gordonii against S. mutans a well-known caries associated oral species (Figure 7B).43,44
Figure 7.
Ecological advantage of spread-out distribution of biofilm clusters. (A) Representative images of H2O2 indicator plates inoculated either in a single area or in four separate areas by using the same number of bacteria (one 80 μL spot vs four 20 μL spots). After 48 h, incubation plates were removed from the incubator for blue surface area measurements as described in the Materials and Methods section. (B) Example of S. mutans UA159 inhibition with a similar setup. The clear zone around the central circle (S. gordonii) is the inhibition zone that was measured to determine the surface area dimensions. (C) Combined surface area dimensions. The measurements for the four individual areas were combined for direct comparison with the surface area dimension from a single area. Shown are averages and standard deviations from four independent experiments for H2O2 production and three independent experiments for S. mutans inhibition.
The production of H2O2 offers a clear ecological advantage, as streptococcal H2O2 production combats nonproducing oral microbes that are susceptible to it, and many are associated with disease development. As shown in Figure 7A, H2O2 production was observed under the tested conditions for both single location inoculation and separate inoculation. However, when the secreted H2O2 area was measured, it became obvious that the four separate inoculations produced a larger combined coverage area. This larger area also coincides with the inhibition zone of S. gordonii, which combats caries-associated S. mutans (Figure 7C). Therefore, several smaller initially occupied areas might provide an advantage for biofilm compared with single-location colonization. Therefore, it can be concluded that the more varied the distribution of bacteria is, the better it is for maintaining a healthy biofilm. Although this is a simplified model, it suggests that the observed cluster-dependent biofilm formation for in situ biofilms might provide the same ecological advantage as we observed here.
CONCLUSION
In this report, we provide evidence that the distribution of H2O2 produced by oral streptococci in multispecies biofilms is essential for understanding the role of biofilm. A new design of a triple SECM tip is introduced, characterized, and modified to be used for simultaneous measurement of pH and [H2O2]. The pH and H2O2 sensors showed Nernstian and linear response, fast response time, and high sensitivity with low detection limit. Simultaneous pH and [H2O2] imaging across the biofilm revealed a clustered distribution of local H2O2 concentrations ranging from 0 to 17 μM, while the local pH remained constant at 7.2. In the context of bacterial H2O2 antagonism, the relationship between local chemical profiles and the distribution of bacterial species within the oral microbiome was experimentally investigated. As a result, this triple SECM tip has the potential to be used to investigate local molecular mechanisms that contribute to oral microbiome dysbiosis. The advantage of clustered H2O2 production was demonstrated by the fact that the total area of H2O2 produced by multiple small clusters is 67% greater than a single cluster using the same starting numbers of bacteria. From the perspective of species distribution in the oral biofilm, the H2O2 produced by various clusters of streptococci in the biofilm is more effective in controlling pathobionts and maintaining homeostasis than that from single clusters.
Supplementary Material
ACKNOWLEDGMENTS
The use of the Zeiss LSM 780 NLO confocal microscope system was made possible in part by award number 1337774 from the National Science Foundation (MRI: Acquisition of Confocal and Two-Photon Excitation Microscopy). We also acknowledge the Confocal Microscopy Facility of the Center for Genome Research and Biocomputing at Oregon State University. We thank the National Institute of Dental Craniofacial Research as a funding agency, NIH Grant No. R01DE027999 (D.K.) and DE021726, DE029492, and DE029612 (J.K.). We would like to thank Dr. Nadeeshani Jayathilake and Dr. Partha Sarathi Sheet for their initial help in electrode fabrication and biofilm experiments.
Footnotes
The authors declare no competing financial interest.
Supporting Information
The Supporting Information is available free of charge at https://pubs.acs.org/doi/10.1021/acs.analchem.2c05258.
SECM probe characterization (Figure S1), electro-chemical characterization of triple-barrel SECM tip (Figure S2), and FISH probe labeled confocal microscopy image of oral biofilm (Figure S3) (PDF)
Contributor Information
Suji Park, Department of Chemistry, Oregon State University, Corvallis, Oregon 97331, United States.
Sriram Kumar, Department of Chemistry, Oregon State University, Corvallis, Oregon 97331, United States.
Claudia S. Maier, Department of Chemistry, Oregon State University, Corvallis, Oregon 97331, United States
Jens Kreth, Department of Restorative Dentistry, Oregon Health and Science University, Portland, Oregon 97201, United States.
Dipankar Koley, Department of Chemistry, Oregon State University, Corvallis, Oregon 97331, United States.
REFERENCES
- (1).Carlsson J. Adv. Dent Res 1997, 11 (1), 75–80. [DOI] [PubMed] [Google Scholar]
- (2).Lamont RJ; Hajishengallis GN; Koo HM; Jenkinson HF Oral Microbiology and Immunology; ASM Press, 2019. [Google Scholar]
- (3).Jakubovics NS J. Mol. Biol 2015, 427 (23), 3662–3675. [DOI] [PubMed] [Google Scholar]
- (4).Marsh PD BMC Oral Health 2006, 6 (1), S14. [DOI] [PMC free article] [PubMed] [Google Scholar]
- (5).Marsh PD; Head DA; Devine DA Journal of Oral Biosciences 2015, 57 (4), 185–191. [Google Scholar]
- (6).Gibbons RJ; Houte JV Annu. Rev. Microbiol 1975, 29, 19–44. [DOI] [PubMed] [Google Scholar]
- (7).Marsh PD; Bradshaw DJ Journal of Industrial Microbiology 1995, 15 (3), 169–175. [DOI] [PubMed] [Google Scholar]
- (8).Kolenbrander PE; London J J. Bacteriol 1993, 175 (11), 3247–3252. [DOI] [PMC free article] [PubMed] [Google Scholar]
- (9).Murray PA; Prakobphol A; Lee T; Hoover CI; Fisher SJ Infect. Immun 1992, 60 (1), 31–38. [DOI] [PMC free article] [PubMed] [Google Scholar]
- (10).Foster JS; Kolenbrander PE Appl. Environ. Microbiol 2004, 70 (7), 4340–4348. [DOI] [PMC free article] [PubMed] [Google Scholar]
- (11).Guggenheim B; Giertsen E; Schüpbach P; Shapiro S J. Dent Res 2001, 80 (1), 363–370. [DOI] [PubMed] [Google Scholar]
- (12).Kolenbrander PE; Andersen RN; Kazmerzak K; Wu R; Palmer RJ Jr. Methods Enzymol 1999, 310, 322–332. [DOI] [PubMed] [Google Scholar]
- (13).Palmer RJ; Caldwell DE J. Microbiol. Methods 1995, 24 (2), 171–182. [Google Scholar]
- (14).Palmer RJ Jr.; Kazmerzak K; Hansen MC; Kolenbrander PE Infect. Immun 2001, 69 (9), 5794–5804. [DOI] [PMC free article] [PubMed] [Google Scholar]
- (15).Kohno T; Kitagawa H; Tsuboi R; Nishimura Y; Imazato S Sci. Rep 2021, 11 (1), 21188. [DOI] [PMC free article] [PubMed] [Google Scholar]
- (16).Al-Ahmad A; Wunder A; Auschill TM; Follo M; Braun G; Hellwig E; Arweiler NB J. Med. Microbiol 2007, 56 (5), 681–687. [DOI] [PubMed] [Google Scholar]
- (17).Arweiler NB; Hellwig E; Sculean A; Hein N; Auschill TM Caries Research 2004, 38 (5), 442–447. [DOI] [PubMed] [Google Scholar]
- (18).Foster JS; Palmer RJ Jr.; Kolenbrander PE Biol. Bull 2003, 204 (2), 200–204. [DOI] [PubMed] [Google Scholar]
- (19).Kolenbrander PE; Egland PG; Diaz PI; Palmer RJ Trends Microbiol 2005, 13 (1), 11–15. [DOI] [PubMed] [Google Scholar]
- (20).Palmer RJ; Wu R; Gordon S; Bloomquist CG; Liljemark WF; Kilian M; Kolenbrander PE [27] Retrieval of biofilms from the oral cavity. In Methods in Enzymology; Doyle RJ, Ed.; Vol. 337; Academic Press, 2001; pp 393–403. [DOI] [PubMed] [Google Scholar]
- (21).Wecke J; Kersten T; Madela K; Moter A; Göbel UB; Friedmann A; Bernimoulin J-P FEMS Microbiology Letters 2000, 191 (1), 95–101. [DOI] [PubMed] [Google Scholar]
- (22).Wood SR; Kirkham J; Marsh PD; Shore RC; Nattress B; Robinson C J. Dent Res 2000, 79 (1), 21–27. [DOI] [PubMed] [Google Scholar]
- (23).Guzmán-Soto I; McTiernan C; Gonzalez-Gomez M; Ross A; Gupta K; Suuronen EJ; Mah T-F; Griffith M; Alarcon EI iScience 2021, 24 (5), 102443. [DOI] [PMC free article] [PubMed] [Google Scholar]
- (24).Simon-Soro A; Ren Z; Krom BP; Hoogenkamp MA; Cabello-Yeves PJ; Daniel SG; Bittinger K; Tomas I; Koo H; Mira A mBio 2022, 13 (1), No. e0013122. [DOI] [PMC free article] [PubMed] [Google Scholar]
- (25).Preda VG; Sandulescu O Discoveries (Craiova) 2019, 7 (3), No. e10. [DOI] [PMC free article] [PubMed] [Google Scholar]
- (26).Muhammad MH; Idris AL; Fan X; Guo Y; Yu Y; Jin X; Qiu J; Guan X; Huang T Front Microbiol 2020, 11, 928. [DOI] [PMC free article] [PubMed] [Google Scholar]
- (27).Rumbaugh KP; Sauer K Nature Reviews Microbiology 2020, 18 (10), 571–586. [DOI] [PMC free article] [PubMed] [Google Scholar]
- (28).Distler W; Kröncke A Archives of Oral Biology 1981, 26 (8), 657–661. [DOI] [PubMed] [Google Scholar]
- (29).Periasamy S; Kolenbrander PE J. Bacteriol 2010, 192 (12), 2965–2972. [DOI] [PMC free article] [PubMed] [Google Scholar]
- (30).Joshi VS; Sheet PS; Cullin N; Kreth J; Koley D Anal. Chem 2017, 89 (20), 11044–11052. [DOI] [PMC free article] [PubMed] [Google Scholar]
- (31).Ummadi JG; Downs CJ; Joshi VS; Ferracane JL; Koley D Anal. Chem 2016, 88 (6), 3218–3226. [DOI] [PMC free article] [PubMed] [Google Scholar]
- (32).Aponso S; Ummadi JG; Davis H; Ferracane J; Koley D J. Dent Res 2019, 98 (2), 194–199. [DOI] [PMC free article] [PubMed] [Google Scholar]
- (33).Jayathilake NM; Koley D Anal. Chem 2020, 92 (5), 3589–3597. [DOI] [PMC free article] [PubMed] [Google Scholar]
- (34).Page A; Perry D; Unwin PR Proc. R. Soc. A 2017, 473 (2200), 20160889. [DOI] [PMC free article] [PubMed] [Google Scholar]
- (35).Page A; Kang M; Armitstead A; Perry D; Unwin PR Anal. Chem 2017, 89 (5), 3021–3028. [DOI] [PubMed] [Google Scholar]
- (36).Takahashi Y; Shevchuk AI; Novak P; Babakinejad B; Macpherson J; Unwin PR; Shiku H; Gorelik J; Klenerman D; Korchev YE; et al. Proc. Natl. Acad. Sci. U.S.A 2012, 109 (29), 11540–11545. [DOI] [PMC free article] [PubMed] [Google Scholar]
- (37).O’Connell MA; Lewis JR; Wain AJ Chem. Commun 2015, 51 (51), 10314–10317. [DOI] [PubMed] [Google Scholar]
- (38).Nadappuram BP; McKelvey K; Al Botros R; Colburn AW; Unwin PR Anal. Chem 2013, 85 (17), 8070–8074. [DOI] [PubMed] [Google Scholar]
- (39).Marzouk SAM Anal. Chem 2003, 75 (6), 1258–1266. [DOI] [PubMed] [Google Scholar]
- (40).Hannig C; Hannig M; Rehmer O; Braun G; Hellwig E; Al-Ahmad A Arch Oral Biol. 2007, 52 (11), 1048–1056. [DOI] [PubMed] [Google Scholar]
- (41).Zhu L; Xu Y; Ferretti JJ; Kreth J PLoS One 2014, 9 (1), No. e86685. [DOI] [PMC free article] [PubMed] [Google Scholar]
- (42).Zhu L; Kreth J Oxidative Medicine and Cellular Longevity 2012, 2012, 717843. [DOI] [PMC free article] [PubMed] [Google Scholar]
- (43).Giacaman RA; Torres S; Gómez Y; Muñoz-Sandoval C; Kreth J Arch Oral Biol. 2015, 60 (1), 154–159. [DOI] [PubMed] [Google Scholar]
- (44).Herrero ER; Slomka V; Boon N; Bernaerts K; Hernandez-Sanabria E; Quirynen M; Teughels W Sci. Rep 2016, 6, 38179. [DOI] [PMC free article] [PubMed] [Google Scholar]
Associated Data
This section collects any data citations, data availability statements, or supplementary materials included in this article.


