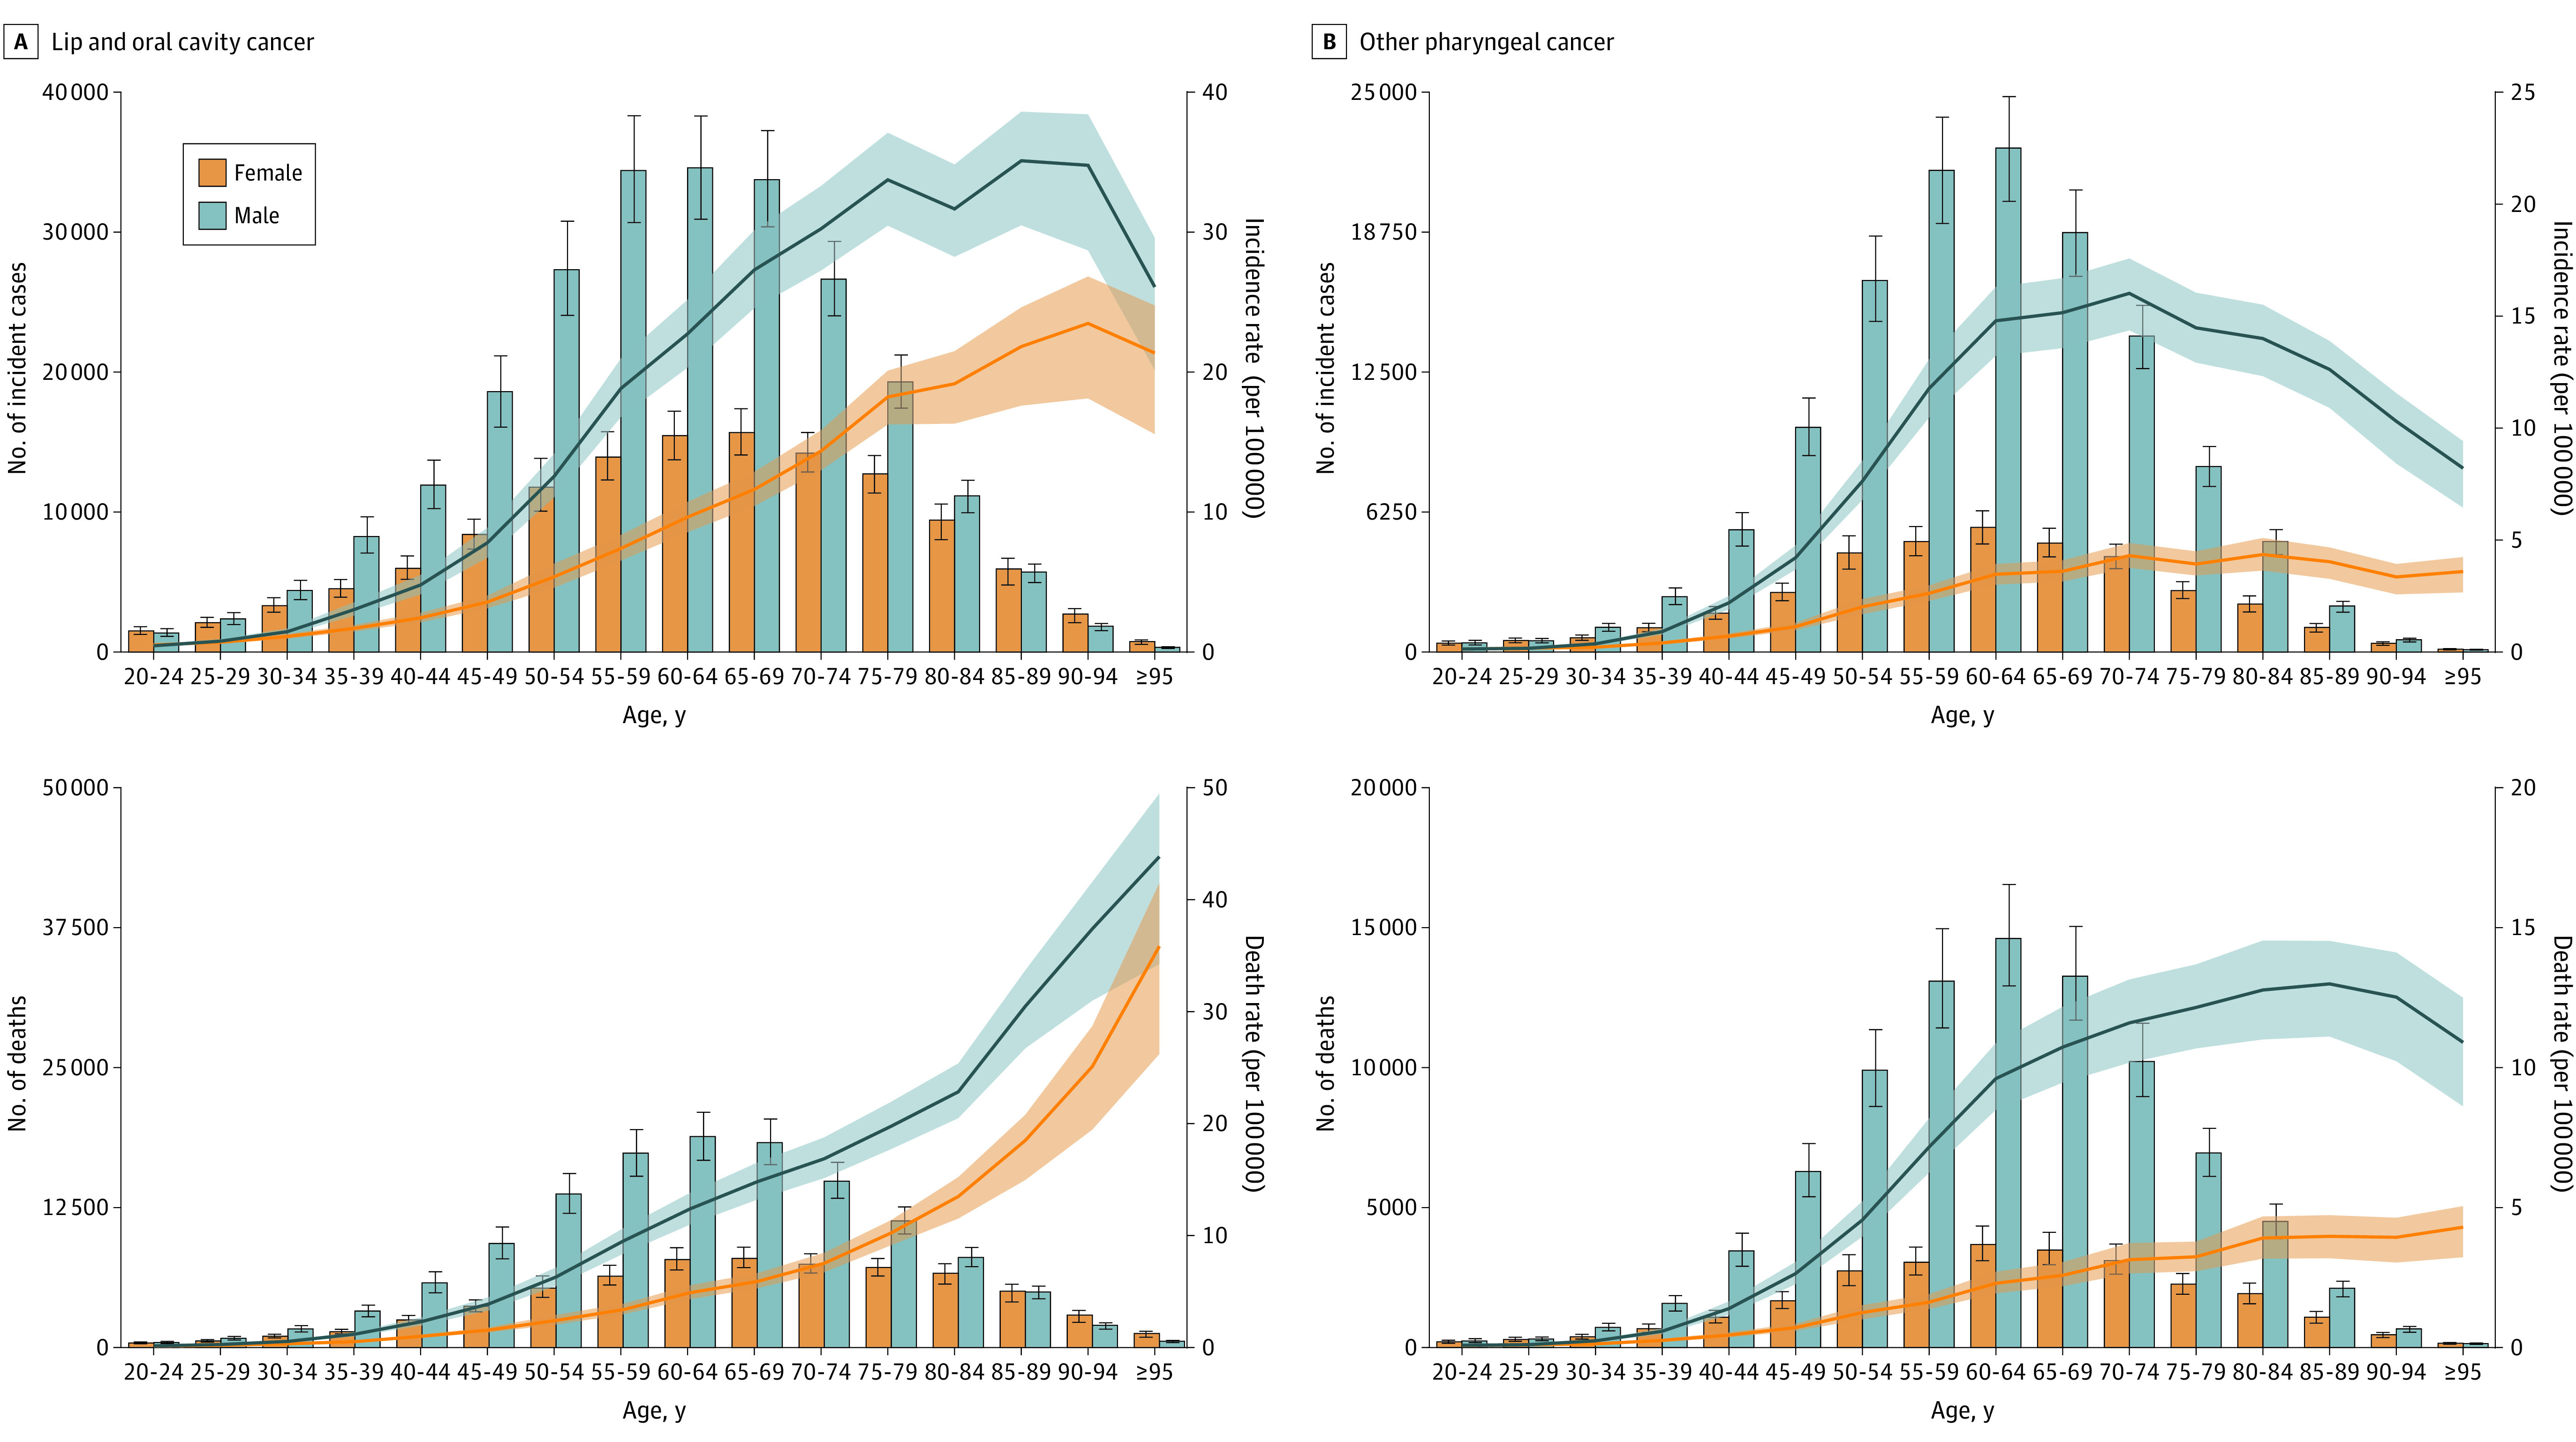
Figure 2. Global Absolute Cases and Deaths and Age-Specific Incidence and Mortality Rates for Lip, Oral, and Other Pharyngeal Cancer by Age Group and Sex in 2019.

Bars indicate absolute numbers, with error bars representing 95% uncertainty intervals. Lines indicate rates, with shaded areas representing respective 95% uncertainty intervals. For an additional version of this Figure showing absolute disability-adjusted life years and age-specific disability-adjusted life year rates (per 100 000), see eFigure 11 in Supplement 1.
