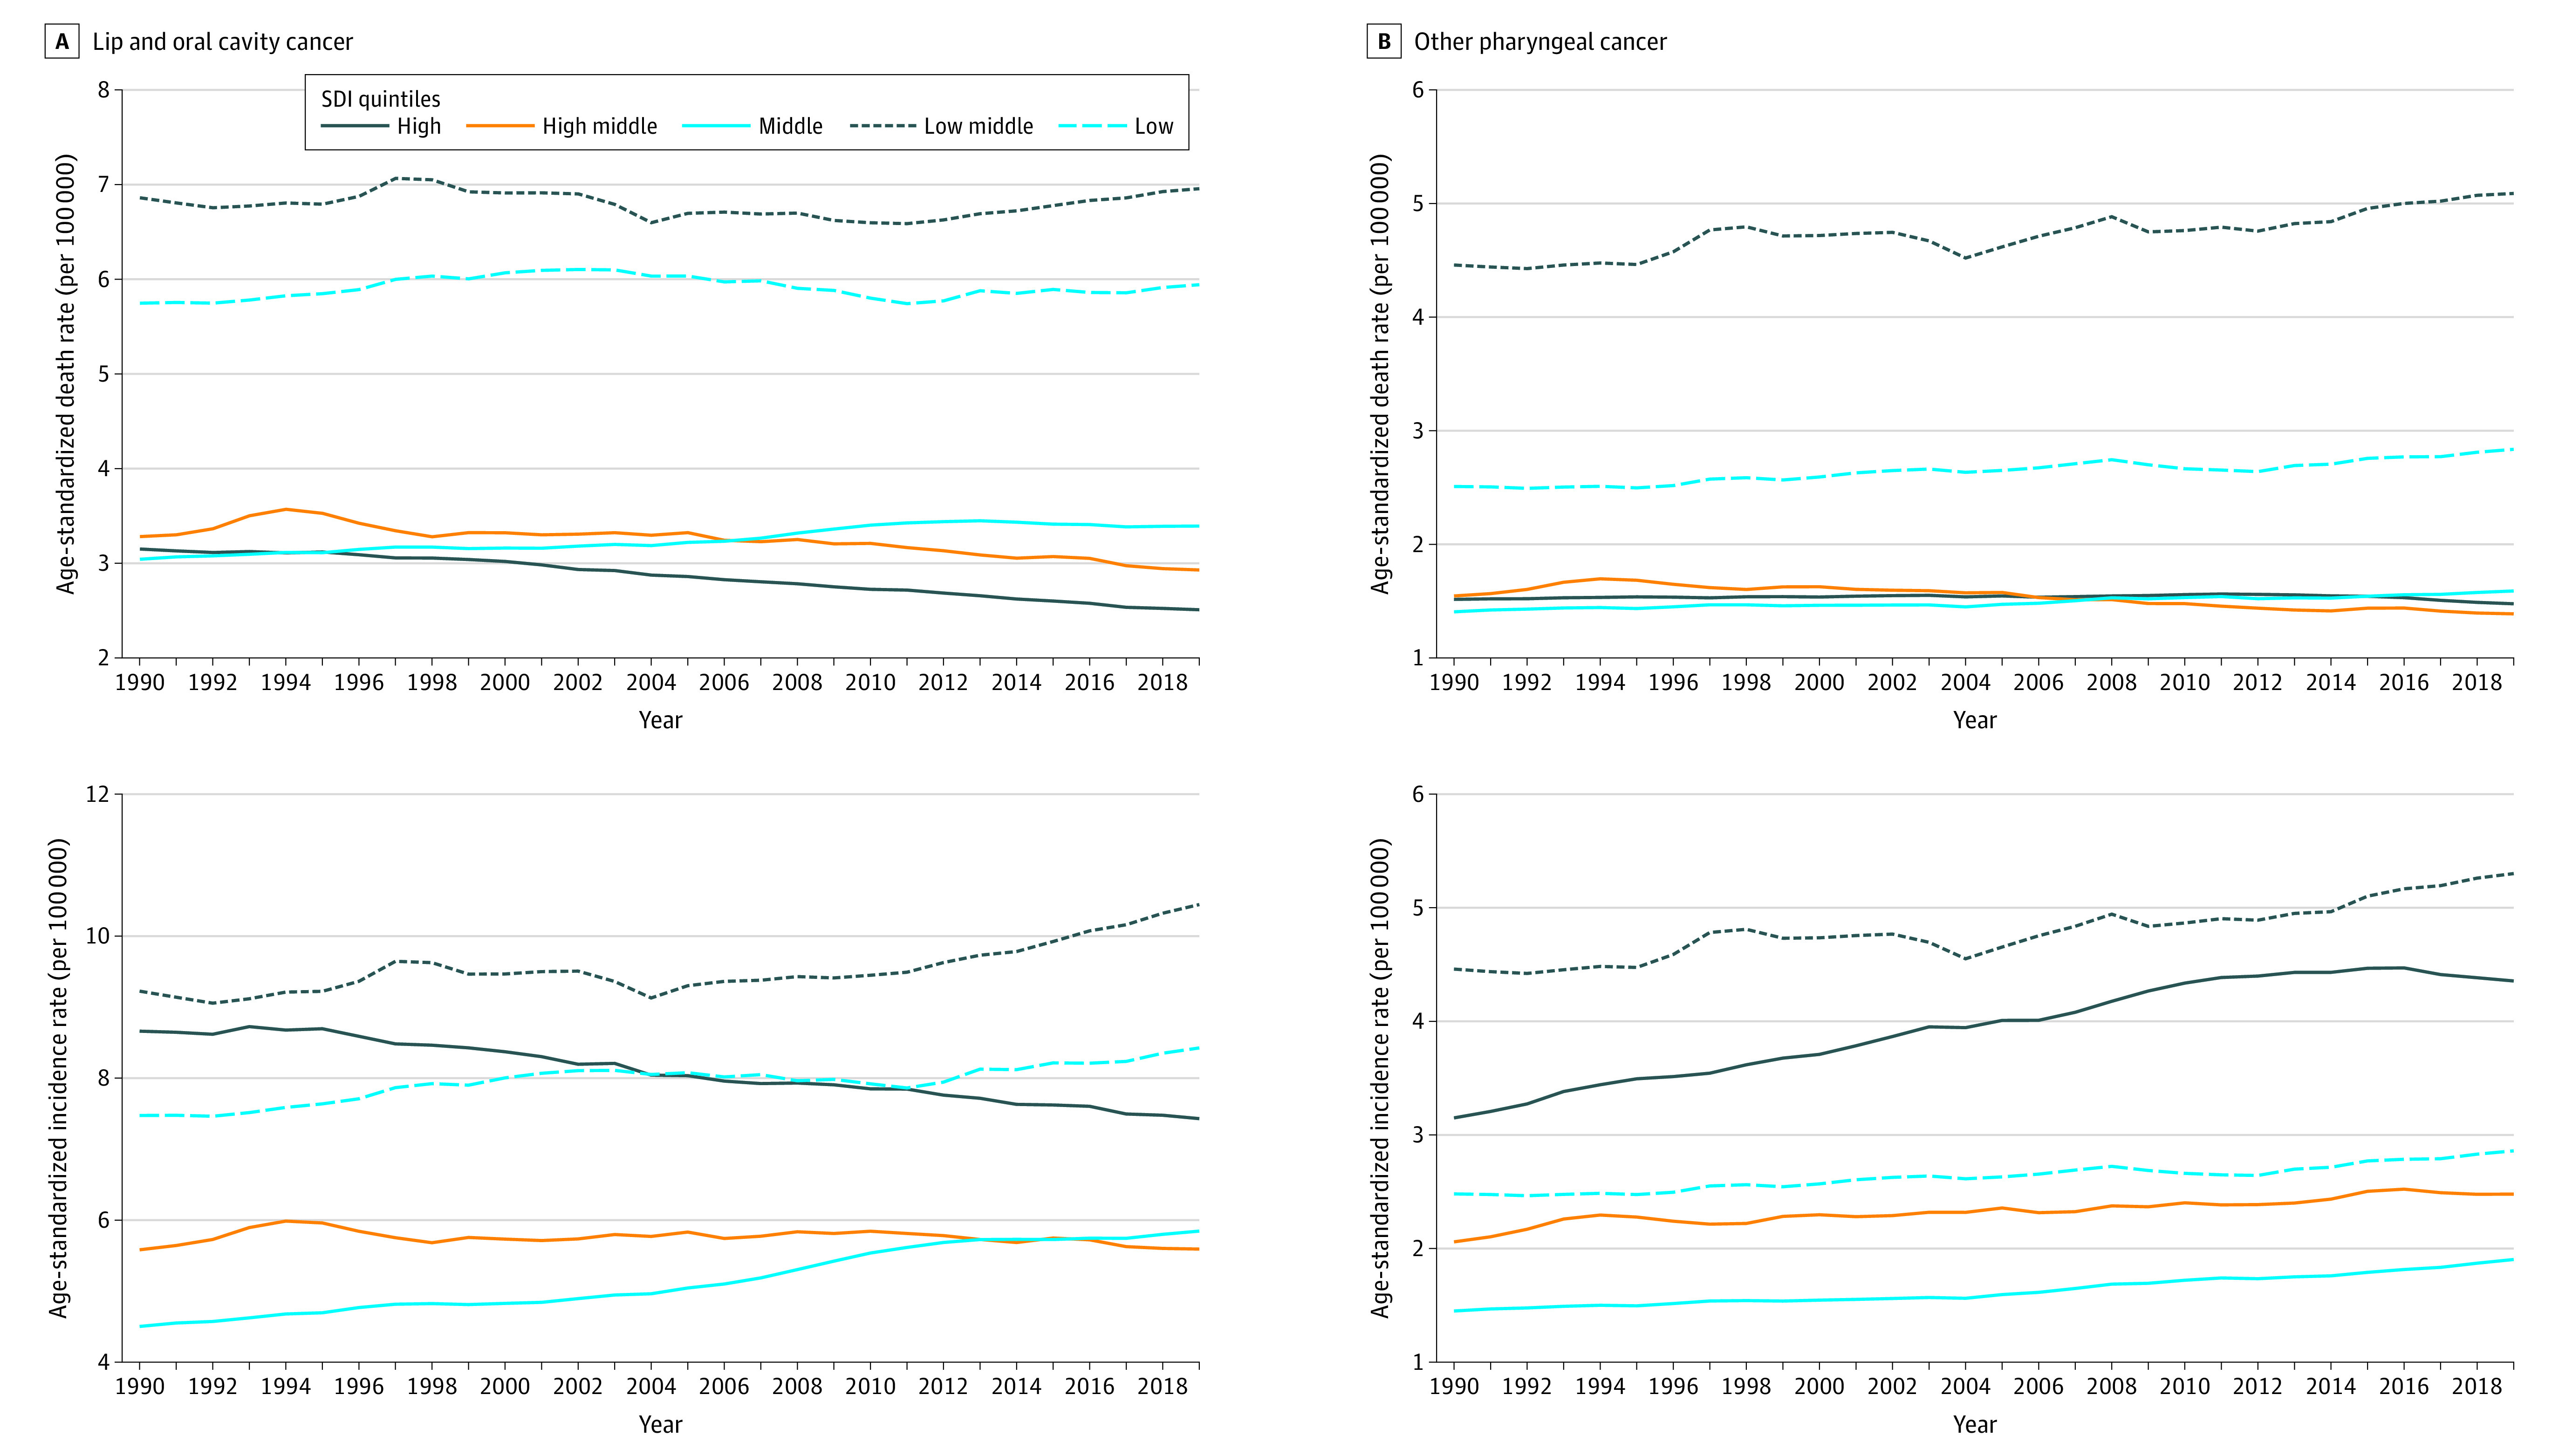
Figure 3. Time Trends of Age-Standardized Death and Incidence Rates for Lip, Oral, and Other Pharyngeal Cancer From 1990 to 2019 by Socio-demographic Index (SDI) Quintile.

Rates represent both sexes combined and are expressed per 100 000 person-years. See eFigure 3 and eTable 7 in Supplement 1 for details and definitions of the SDI quintiles. For additional versions of this Figure, showing time trends of deaths, incidence, and disability-adjusted life years, see eFigure 12 (by SDI quintile), eFigure 13 (by sex), eFigure 14 (by 10-year age group), and eFigure 15 (by Global Burden of Diseases, Injuries, and Risk Factors Study super-region) in Supplement 1.
