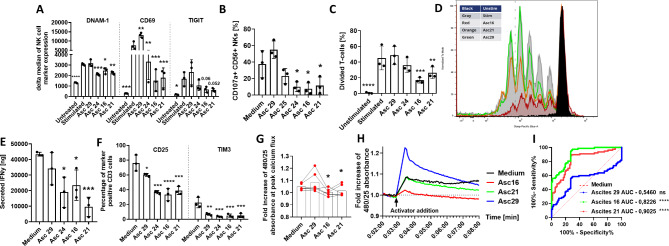
Fig. 2.
Malignant ascites causes dysfunction during in vitro activation of NK and T cells. (A) Expression of surface markers on stimulated NK cells in presence of ascites. Isolated healthy donor NK cells were coincubated with IL2 (400 U/ml) either in medium or 25%ascites-supplemented media. After 48 h expression of DNAM-1, CD69 and TIGIT was measured by FACS. (B) NK cytotoxicity of stimulated NK cells in presence of ascites. Percentage of CD107a-positive NK cells was assessed by FACS after 6-hours of stimulation with PMA (50ng/ml) and Ionomycin (1 µg/ml) either in media or 25% ascites-supplemented media. (C-F) Stimulation of T cells in presence of ascites. Isolated healthy donor T-cells were prestained with Cell Proliferation Dye EFluor 450 and stimulated using CD2/CD3/CD28 activator complex (1:40) either in medium or 25%ascites-supplemented media for four days. (C) Graph showing T cells proliferation. (D) Representative experiment showing T cell proliferation. (E) Secreted IFNγ [ng/ml] during T cell proliferation determined by ELISA. (F) Percentage of CD25-positive (left column) and TIM3-positive T cells (right column). (G + H + I) Intracellular Calcium-flux during T cell stimulation in presence of ascites. T cells were exposed to CD2/CD3/CD28 activator either in presence of ascites or medium. Intracellular Ca2 + flux was monitored via Fluo-4 dye. (G) Fold increase of 480/25 absorbance at peak of calcium flux. (H) Representative experiment of calcium flux after T cell stimulation in presence of ascites. (I) ROC analysis shows significant difference between calcium flux curves in suppressive ascites environment (red and green line) compared to medium (dotted red line). Data are presented as individual values with mean value as center of error bar ± standard deviation. Each datapoint represents one healthy donor. The normalization was done according to normal medium control. For significance testing ordinary one-way (2.A-C, E-F) and paired (2.G) ANOVA or ROC analysis (2.I) were performed, followed by Dunnett’s multiple comparison posthoc test between ascites and medium control group where appropriate. * (p < 0.05), ** (p < 0.01), *** (p < 0.001), **** (p < 0.0001)

