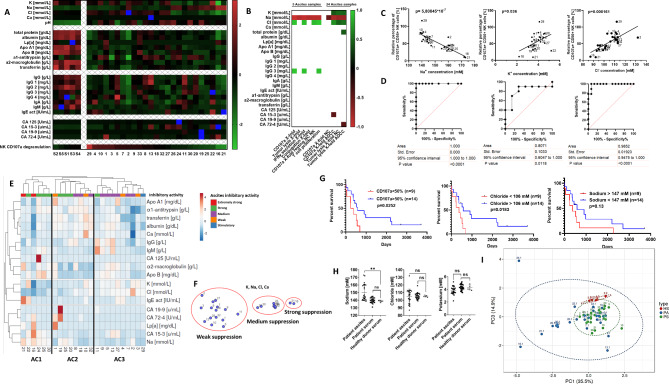
Fig. 3.
Aberrant electrolyte concentrations in malignant ascites contribute to suppression of immune cell functions. (A) Content of ascites and healthy donor serum. Components of ascites samples and healthy serum samples were determined by clinical chemistry analysis. Presented in the heatmap are calculated z-score values for each component. (B) Correlation between quantified ascites components and NK effector function. The matrix depicts significant positive and negative correlations (p < 0,05) between quantified ascites components and different NK effector functions. (C) Correlation between NK ADCC and electrolyte content in ascites. Pearson correlation shows negative correlation for sodium (left) and positive correlation for potassium (middle) and chloride (right) with NK ADCC. (D) Relationship between electrolytes in ascites and NK cytotoxicity. ROC (Receiver operating characteristic) curve showing the relationship between the concentrations of sodium (left), potassium (middle) and chloride (right) and 50% of NK cell degranulation inhibition. (E and F) Clustering of ascites samples. (E) Hierarchical clustering of ascites samples according to clinical chemistry data. (F) t-SNE plot showing the clustering of ascites samples according to electrolyte content. (G) Impact of electrolyte content in ascites on patient survival. Kaplan-Meier curves showing significant negative association of suppressed NK cytotoxicity (left), low chloride (middle) and high sodium content in ascites with patient survival. (H and I) Composition comparison of ascites, patient serum and healthy donor serum. (H) Comparison of the concentrations of sodium (left), chloride (medium), and potassium (right) between healthy donor and patient serum and ascites. (I) PCA plot showing clustering of ascites, patient and healthy donor serum done using clinical chemistry data. Two-tailed Pearson correlation (3.C) and ROC analysis (3.D) were used. Kaplan Meier curves (3.G) for overall survival were used with Mantel-Cox test (log-rank). Each datapoint represents one ascites sample. For significance testing ordinary one-way ANOVA was performed, followed by Dunnett’s multiple comparison posthoc test between ascites and healthy or patient serum (3.H). ns (non-significant), ** (p < 0.01)

