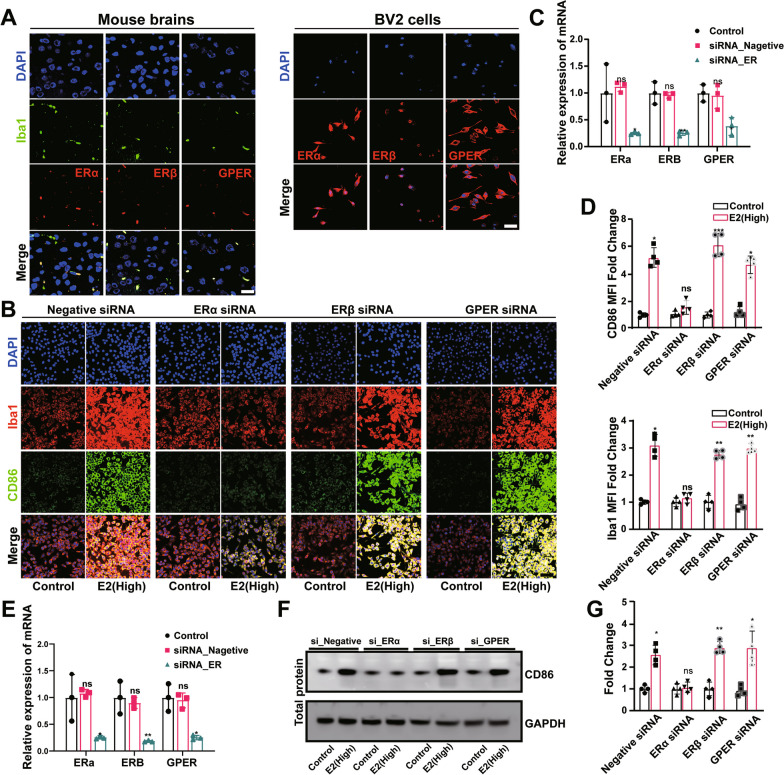
Fig. 4.
Microglial response caused by high-dose of estrogen (hE2) via ERα. A Representative images of microglia (Iba1-labeled) and estrogen receptors (Erα, ERβ, and GPER) co-located in mouse brain and BV2 cells by immunofluorescence. Bar = 15 μm. The siRNAs are used to suppress different estrogen receptors (ERs) in BV2 cells. Negative siRNA is used as the negative control. The effects of hE2 on CD86 and Iba1 are subsequently analyzed. B Representative images of microglia (Iba1-labeled) and M1 polarization markers (CD86) co-located by immunofluorescence. C qPCR analysis of ER proteins in BV2 cells transfected with different siRNAs to suppress the corresponding ER. D Quantification of the mean fluorescence intensity per cell with the indicated number of cells. E The siRNAs are used to suppress different estrogen receptors (ERs) in primary microglia. Results of qPCR analysis of ER proteins in primary microglia transfected with different siRNAs to suppress the corresponding ER. Representative band (F) and quantification (G) of protein expression in primary microglia. Students t-test is performed to determine the significant difference based on P < 0.05 (*), P < 0.01 (**), and P < 0.001 (***), respectively, in comparison to the control group as indicated by black asterisks or “ns” (i.e., no statistical significance). Data are presented as mean ± standard deviation (SD)

