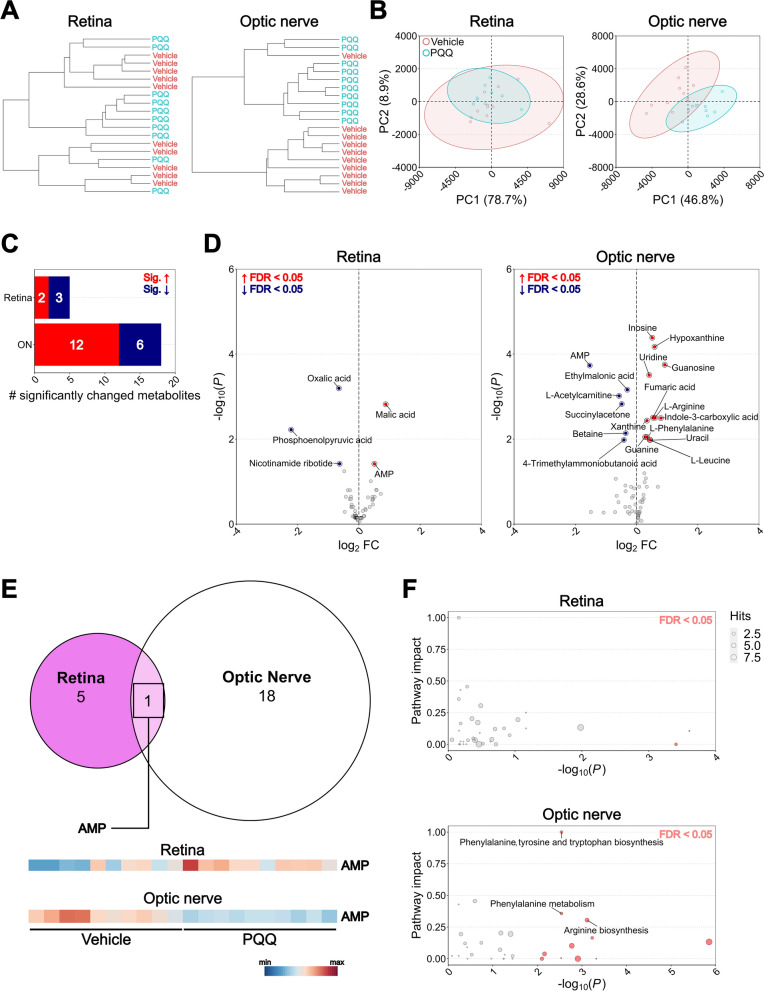
Fig. 8.
Effects of PQQ administration on metabolic profile of non-diseased RGC- related tissues in vivo. A, B Dendrograms (A) and principal component analysis (PCA; B) of retinal and optic nerve samples collected from mice treated with either vehicle or a single injection of 20 mg/kg PQQ after 24 h. C, D Bar chart (C) and volcano plots (D) indicating respectively the number and the increase/decrease of significantly changed metabolites in retinas and optic nerves from PQQ-treated animals compared to their vehicle-injected controls (FDR < 0.05; red = increased in PQQ, blue = decreased). E Euler plot and heatmaps showing commonly changed metabolites across tissues. The red and the blue in the heatmaps indicates respectively the highest and the lowest value by row. F KEGG pathway analysis indicating the predicted affected pathways based on the detected changed metabolites in retinas and optic nerves from PQQ-treated mice. Pathways were highlighted in red when FDR < 0.05 and annotated when the impact was high. The size of the points indicates the pathways hits, underlining the number of the metabolites detected within the pathway. n = 10 retinas or optic nerves per group

