
Fig. 4.
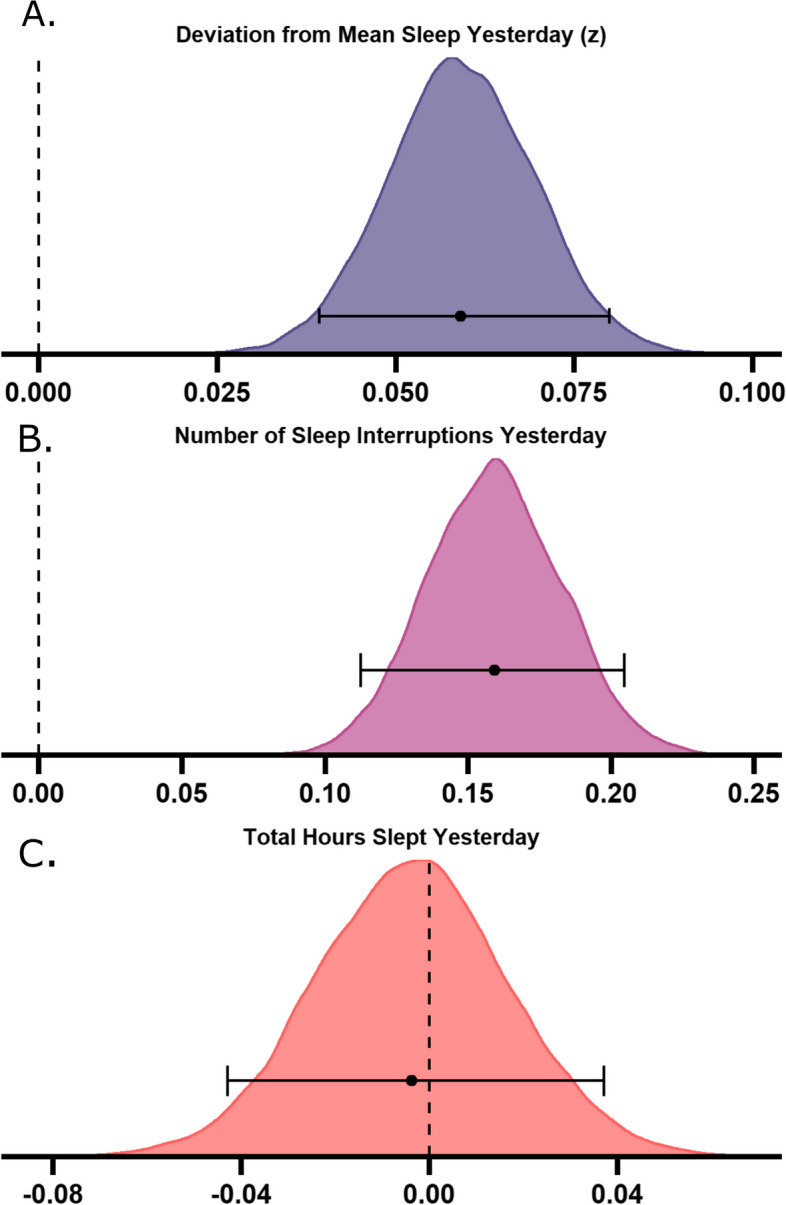
Bayesian posterior distributions for sleep variables predicting migraine attacks. Larger deviations from typical sleep (A M = 0.06, 95% highest density interval (HDI) [0.04 – 0.08]) and a greater number of sleep interruptions (B M = 0.16, 95% HDI [0.11 –0.21]) predict occurrence of a next day migraine attack, but total hours slept does not (C M = -0.00, 95% HDI [-0.04 – 0.04]). Density plots show posterior distributions for the population means of the three tested sleep-related predictor variables on whether a migraine attack occurred or not. The x-axis represents b-value estimates of the parameter. Error bars indicate the 95% highest density interval, with the central point indicating the mean of the posterior distribution