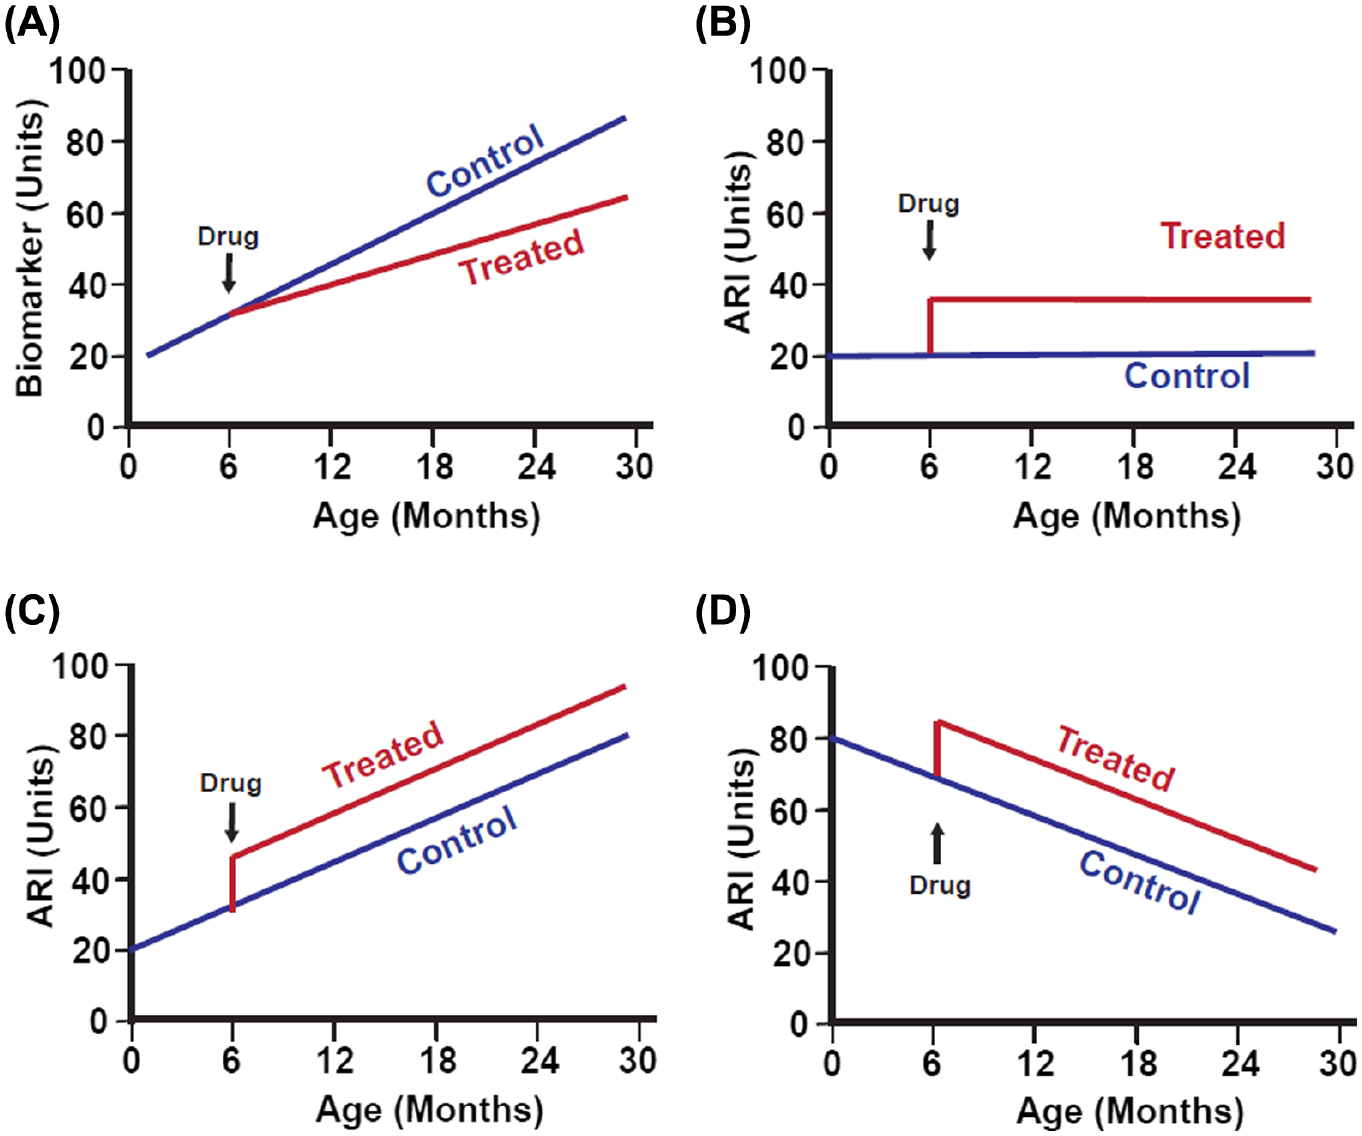
Figure 1.

Schematic diagrams showing hypothetical effects of an antiaging drug, initiated at 6 months of age, on (A) a generic biomarker of aging or on three different aging rate indicators (ARIs), (B) one of which does not show age effects, (C) one of which increases with age, and (D) one of which decreases with age. In this hypothetical example, the drug is assumed to induce very rapid changes in the ARIs, but the pace of effect on an ARI may well differ among interventions and must be determined empirically. Classification of a trait as an ARI does not depend on whether it changes with age. In panels (B–D), it is arbitrarily assumed that the hypothetical ARI is elevated in slow-aging mice, but some ARIs are lower in treated than in control animals (such as iNOS and cytokine levels in fat-associated macrophages).
