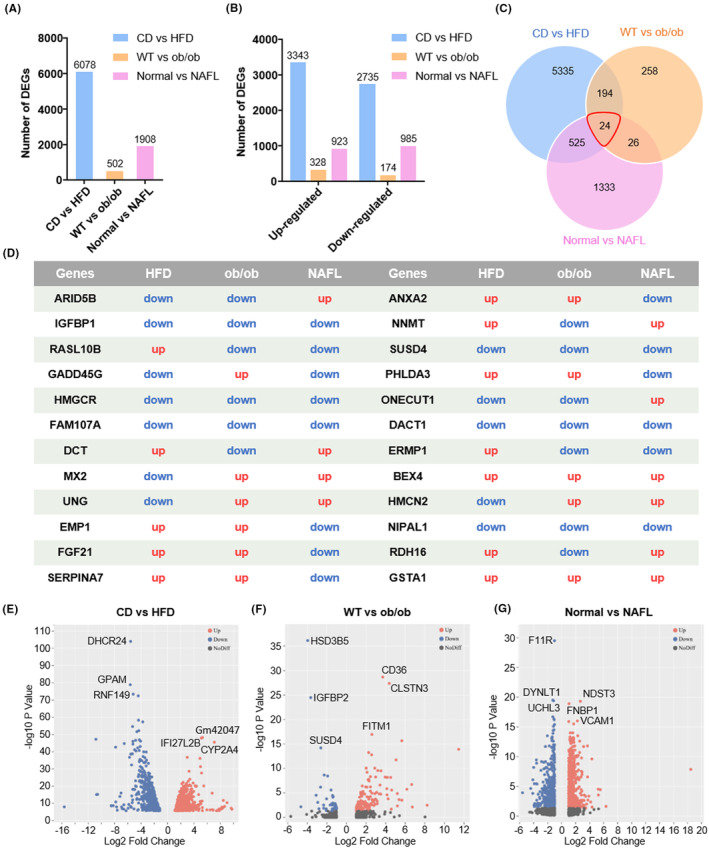
FIGURE 3.

Overview of hepatic gene expression profiles in CD (chow diet) versus HFD (high‐fat diet) mice, WT (wild type) versus ob/ob mice, and normal versus NAFL (nonalcoholic fatty liver) patients. (A) Numbers of DEGs (differential expression genes) in the livers of three groups. (B) Numbers of upregulated and downregulated genes in the livers of three groups. (C) Venn diagrams of DEGs. The cutoff for the differential expression is onefold. (D) The expression changes in 24 common DEGs in three groups. Volcano plots of mRNAs (messenger RNA) between (E) CD and HFD mice, (F) WT and ob/ob mice, and (G) normal people and NAFL patients. The plots were constructed by plotting –log10 adjusted p‐value on the y‐axis and log2 fold change on the x‐axis. Blue blots represent downregulated genes, red dots represent upregulated genes, and black blots represent mRNAs without significant difference.
