FIGURE 6.

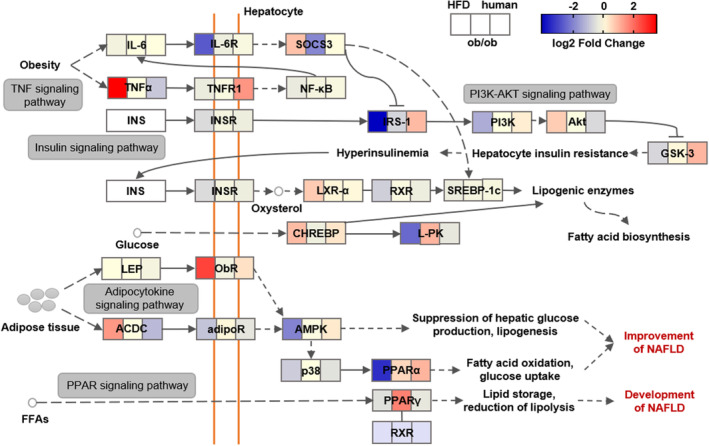
Comparison of differential expression response for NAFL (nonalcoholic fatty liver) pathway‐related genes in two mouse models and NAFL patients. Color scale of log2 fold changes: the lowest (blue) to the highest (red).

Comparison of differential expression response for NAFL (nonalcoholic fatty liver) pathway‐related genes in two mouse models and NAFL patients. Color scale of log2 fold changes: the lowest (blue) to the highest (red).