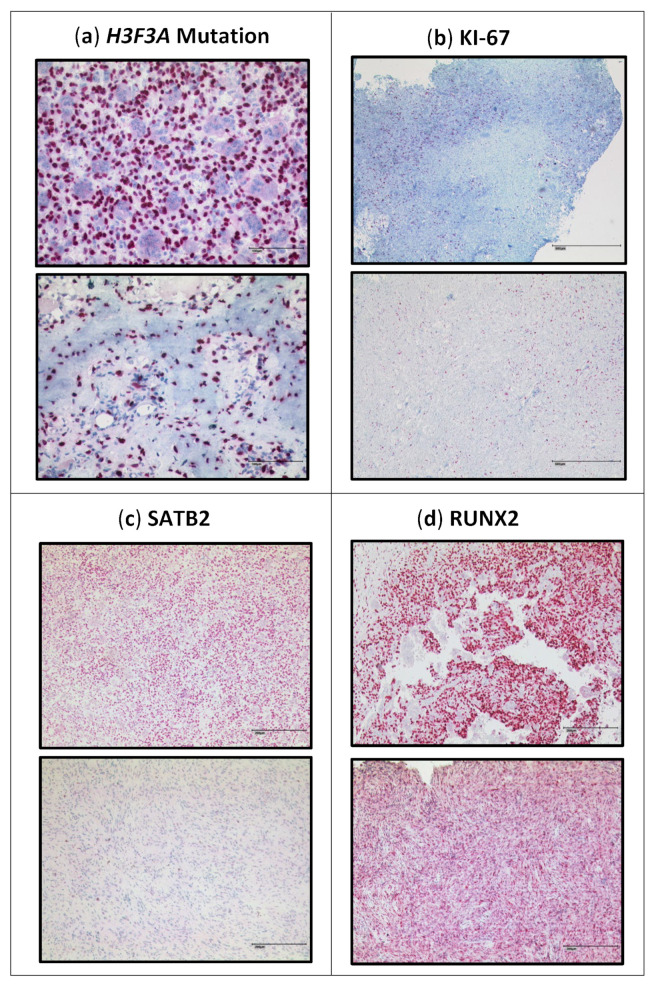
Figure 4.
Immunohistochemical staining: upper image before denosumab, lower image after denosumab. (b) KI-67 staining, the upper part shows an example of our observation that foci with a high KI-67 index are associated with a higher density of giant cells. Scalebar in (a): 100 µm; in (b): 500 µm; in (c,d): 200 µm.

