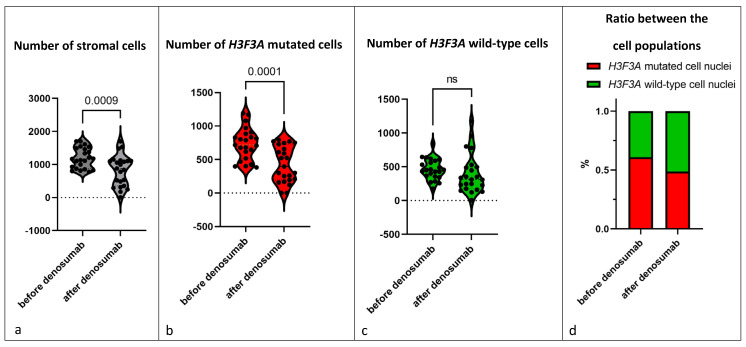
Figure 5.
Every individual data point shows the mean of total number of (a) stromal cells, (b) H3F3A mutated cells and (c) H3F3A wild-type cells counted in three representative microscopic fields (200× magnification). Violin diagram is used to show the distribution of the data, small dotted lines show median and quartiles. (d) The respective shares of the cell populations in the total stromal cell count. The graphs show all 23 GCTBs treated with denosumab (but without malignant transformation) and compare before and after denosumab therapy.

