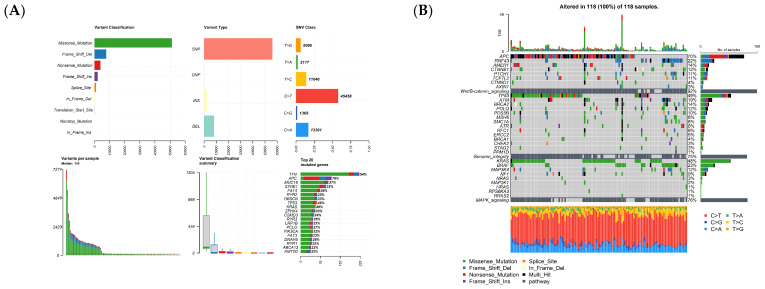
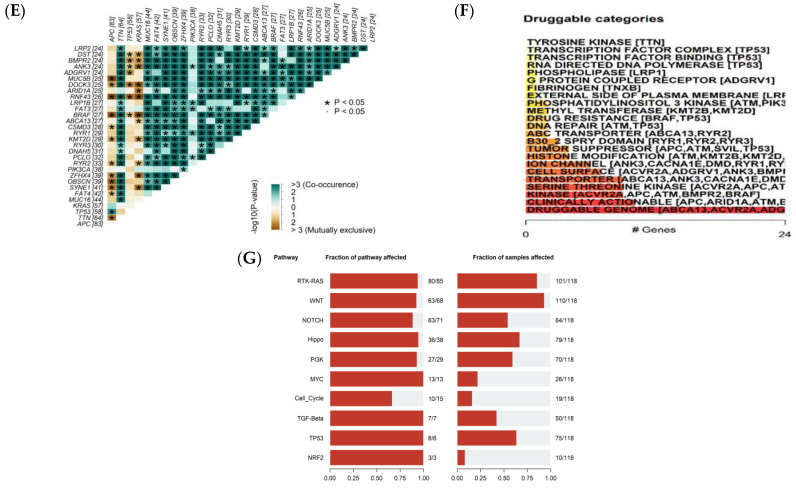
Figure 1.
Visualization and summary of the analysis results of MAF data in the early-stage group (I, II stages) with the maftools package. (A) Bar and box plots display the frequency of different variants across samples (DEL: Deletion, INS: Insertion, SNP: Single-nucleotide polymorphism, ONP: Oligo-nucleotide polymorphism). (B) Oncoplots (note: variants annotated as Multi_Hit are genes that are mutated repeatedly within the same sample). (C) Transition and Transversion mutations (Ti: Transition; Tv: Transversions). (D) A boxplot of Variant Allele Frequencies. (E) Somatic Interactions show results of exclusive/co-occurrence event analysis. (F) Drug–gene interaction analysis based on the Drug–Gene Interaction database. (G) Oncogenic Signaling Pathways.


