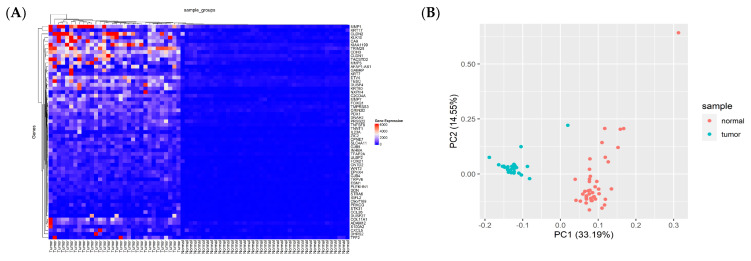
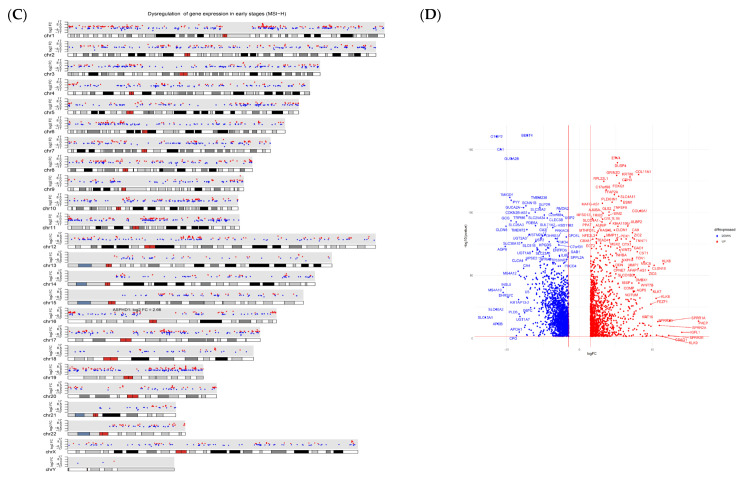
Figure 3.
The results of the analysis of differentially expressed genes (DEGs) in colorectal adenocarcinoma (COAD) were generated using R software https://www.r-project.org/. (A) The heat map. (B) Principal component analysis (PCA). (C) karyoplot. (D) Volcano plot.


