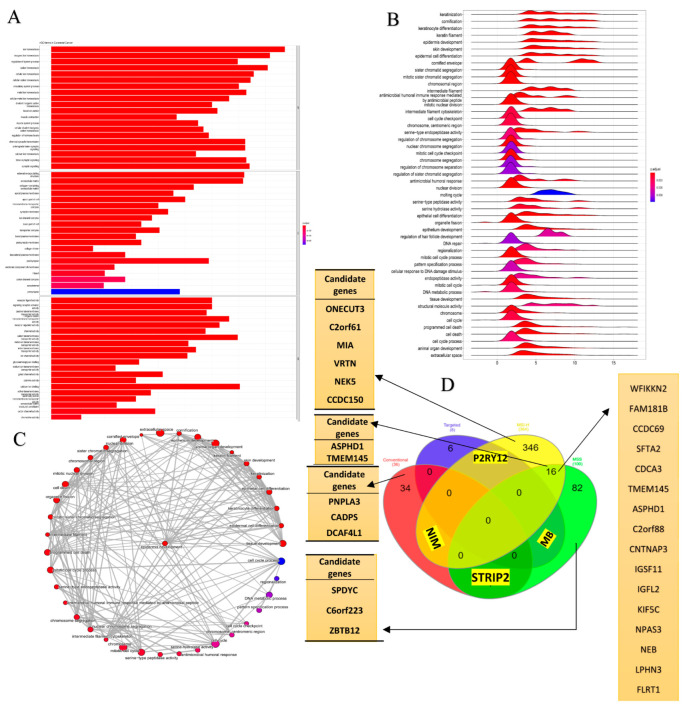
Figure 4.
(A) Gene Ontology (GO), (B) GSEA functional annotation, and (C) Reactome functional pathways in colorectal adenocarcinoma (COAD). The p-value is less than 0.05 and is shown by the color. (D) A Venn diagram indicating the number of survival-related genes and the overlap between the different subgroups.

