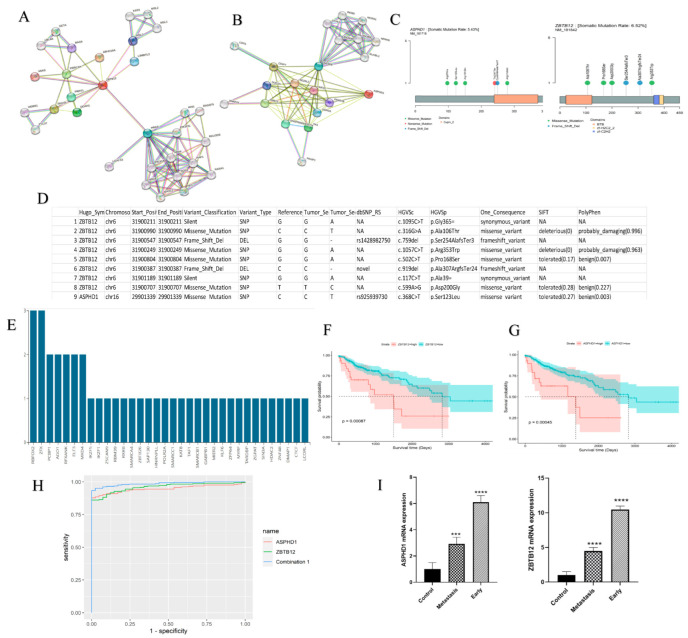
Figure 6.
(A,B) Protein–protein interaction (PPI) network of the two genes (ZBTB12, ASPHD1) identified by survival analysis from STRING. (C,D) The different types of ZBTB12 and ASPHD1 variants, along with their respective alterations in the amino acid sequence on chromosomes, as well as the rate of somatic mutation. (E) CHIP-seq results have shown that variants of two genes (ZBTB12, ASPHD1) affect the binding site of transcription factors and various regulatory factors from the Regulome DB Database. (F,G) Kaplan–Meier plot of ZBTB12 and ASPHD1 with a prognostic value, p-value < 0.05. (H) ROC curve analysis revealed the biomarker potency of ZBTB12 and ASPHD1 individually and together using R 4.3.1’s combioROC package. (I) qRT-PCR results indicate that the expression levels of the two genes (ZBTB12 and ASPHD1) are elevated in tumor tissue compared to non-neoplastic tissue. *** p > 0.01; **** p > 0.001.

