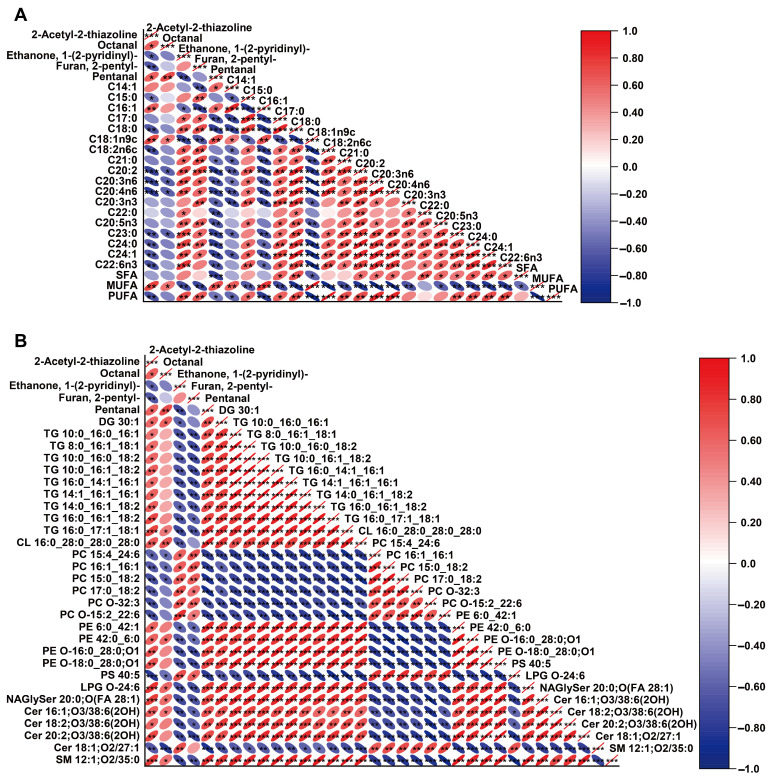
Figure 6.
Correlation map for the differential volatile aroma compounds with differential fatty acids (A) and screened lipid markers (B). Red and blue ellipses indicate positive and negative correlations, respectively. The darker color of the graph represents the stronger correlation, * p < 0.05; ** p < 0.01; *** p < 0.001.

