Figure 5.
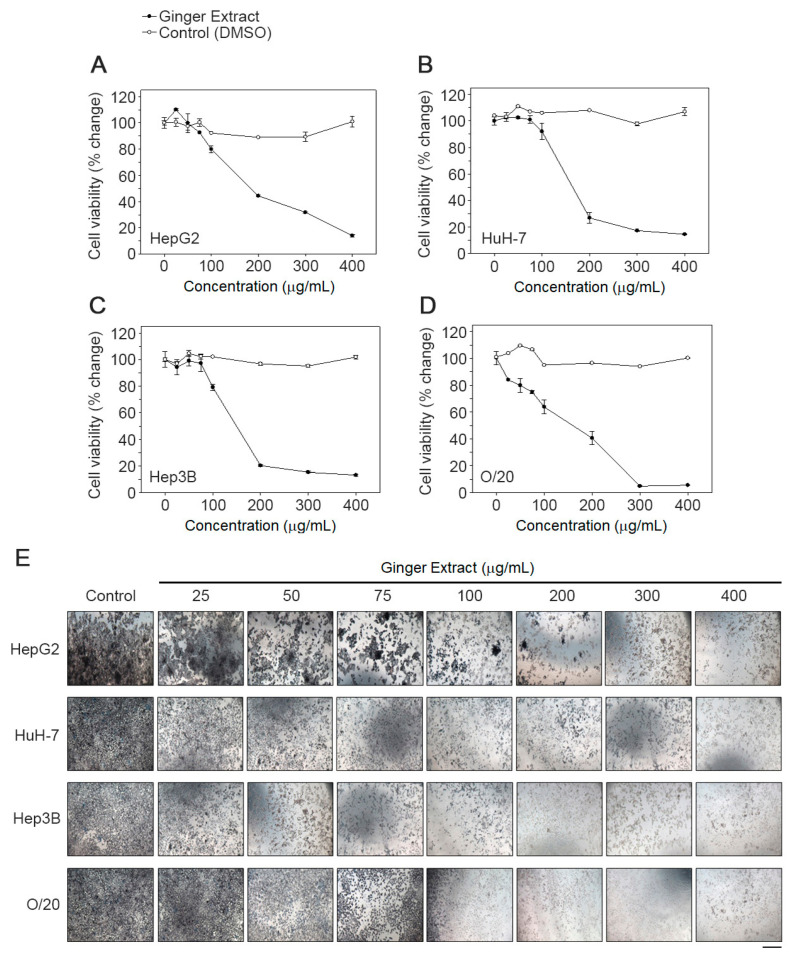
GE inhibits proliferation of HCC cells. A dose response effect of GE on (A) HepG2, (B) HuH-7, (C) Hep3B and (D) O/20 cell proliferation was determined using an MTT assay as described in the text. Each data point represents the means of 3 independent experiments with bars showing the standard deviation. The IC50 values were calculated and compared using one-way ANOVA. (E) Effect of GE on cell morphology. The images were taken at a magnification 100×. Images are representative of three independent experiments. Scale bar: 10 μm.

