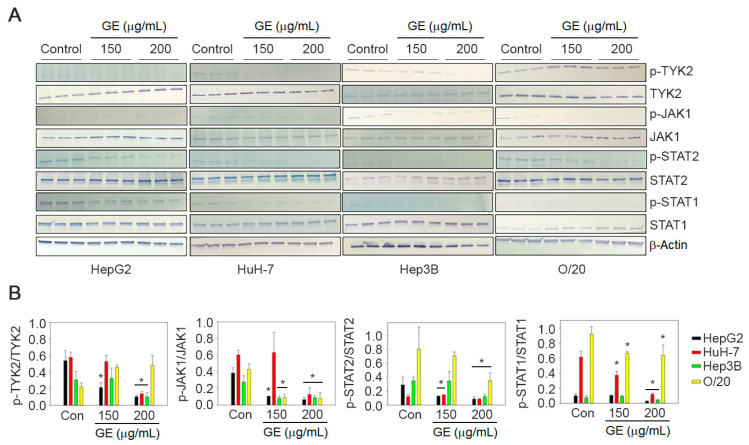
Figure 6.
GE inhibits JAK/STAT signaling pathway in HCC cells. (A) HepG2, HuH-7, Hep3B and O/20 cells were treated with GE at 150 and 200 µg/mL. The cell lysates were immunoblotted with phospho- and unphospho-TYK2, JAK1, STAT2 and STAT1 antibodies. β-Actin was used as a loading control. Representative images are shown. Full pictures of the Western blots and the densitometry scans are presented in File S1. (B) Graphical representation of quantification of the Western blot analysis. Data are expressed as mean ± SEM; * p < 0.05 versus control for each gene in each cell line.

