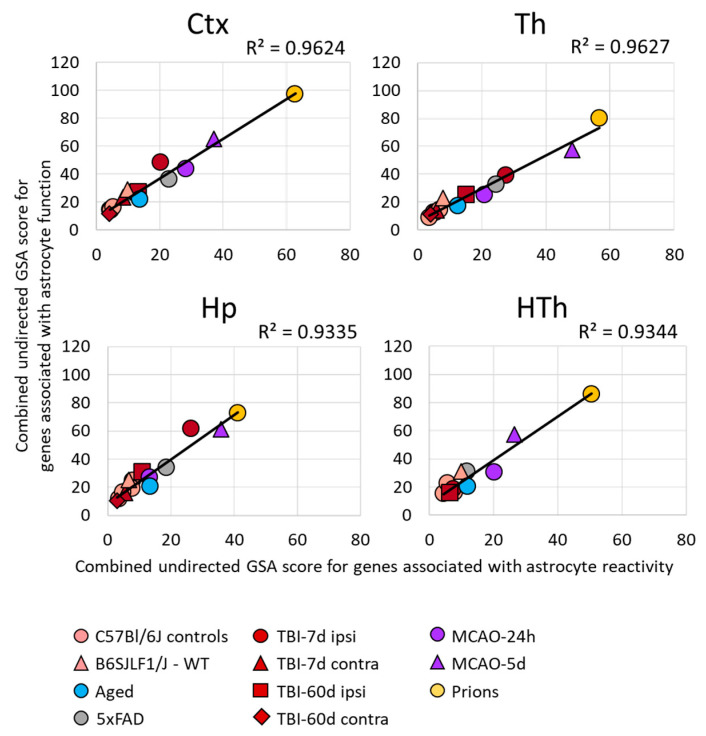
Figure 2.
Relationship between the changes in the expression of gene sets in different brain regions. A strong correlation between the sum of undirected GSA scores of the gene sets reporting astrocyte reactivity (A1-, A2-, pan-specific markers, and other markers of reactive astrocytes) and dysregulation of astrocyte function (BBB regulation, channels, lipid metabolism, myelination, energy metabolism, extracellular matrix, gliotransmitters, neurotransmitters, transporters, neuroprotection, neurotoxicity). Each symbol represents a distinct experimental or control group, as indicated. Ctx—cortex, Hp—hippocampus, Th—thalamus, HTh—hypothalamus.

