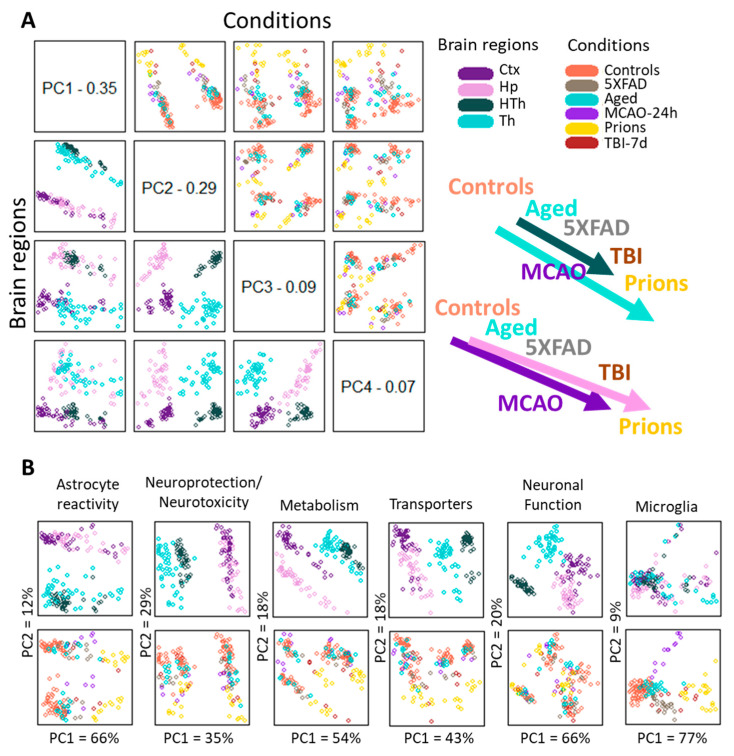
Figure 3.
Principle Component Analysis. (A) PCA performed using the entire panel of genes for samples from five experimental groups and four brain regions. The control group in the PCA included Normal, TBI-7d Ctrl, and Sham-24h samples combined. The distribution of samples according to brain region and condition is shown on the left bottom and top right plots, respectively. A schematic illustration of continuums of astrocyte gene expression signatures is shown on the right. (B) PCA performed using selected gene sets for the same samples. In panels (A,B), each dot represents an individual animal, with different colors representing different brain regions or experimental conditions. Ctx—cortex, Hp—hippocampus, Th—thalamus, HTh—hypothalamus.

