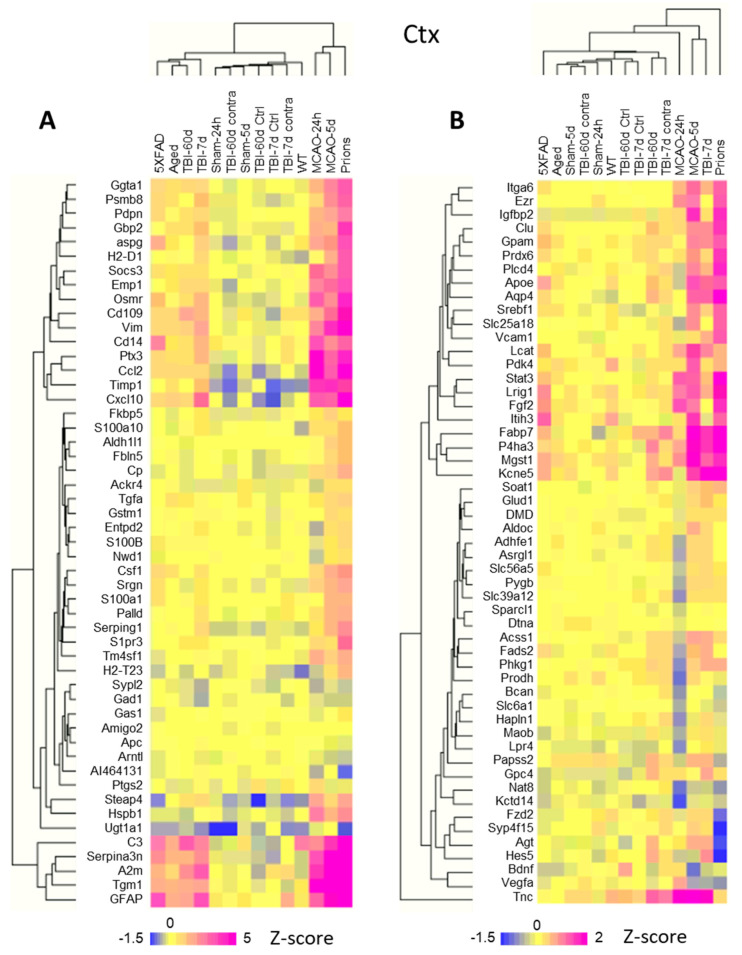
Figure 5.
Hierarchical clustering of log2 changes in the expression of selected genes in the cortex. (A) Selected astrocyte reactivity reporters form several separate clusters displaying an insult-specific pattern of activation. (B) Hierarchical clustering of selected astrocyte function genes highlights insult-specific changes in their expression. Hierarchical clustering was performed for groups with a number of samples, as described in Table S2. TBI-7d and TBI-60d represent ipsilateral samples. Z-score transformation was applied to the genes.

