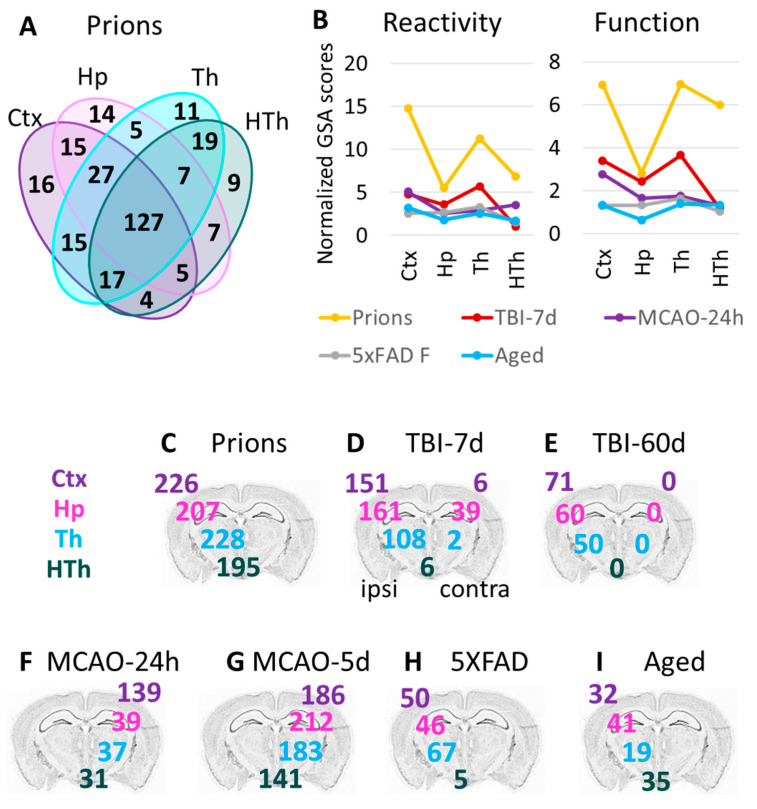
Figure 6.
Region-specific changes in gene expression. (A) Venn diagram for DEGs in four brain regions of the Prions group (females and males, n = 3 + 3) compared to the Normal group (females and males, n = 6 + 3). (B) Combined undirected global significance scores characterizing astrocyte reactivity (left) and function (right) in four brain regions after five insults. Undirected global significance scores were calculated with gene set analysis (GSA) for individual gene sets and were then summed to obtain combined GSA scores for Reactivity and Function for each brain region and insult. The combined GSA scores for Reactivity included GSA scores for A1-, A2-, pan-specific markers, and other markers of reactive astrocytes. The combined GSA scores for Function included GSA scores for BBB regulation, lipid and energy metabolism, extracellular matrix, myelination, channels, transporters, gliotransmitters and neurotransmitters, and neuroprotection. To normalize, the combined GSA scores for each insult were divided by the corresponding GSA scores obtained for the Normal group. TBI-7d is represented by ipsilateral Ctx, Hp and Th, and whole HTh. (C–I) The number of differentially expressed genes (DEGs) in all experimental groups (Table 1): Prion (C), TBI-7d (D), TBI-60d (E), MCAO-24h (F), MCAO-5d (G), 5XFAD (H), and Aged (I). The numbers for DEGs in the cortex, hippocampus, thalamus, and hypothalamus are displayed over the corresponding regions of the brain. Differential expression analysis was performed using NanoString Advanced Analysis software 2.0.115. Each group was compared to its corresponding controls (Table 1). DEGs for the Aged group were calculated relative to the youngest control group (TBI-7d Ctrl, n = 3F).

