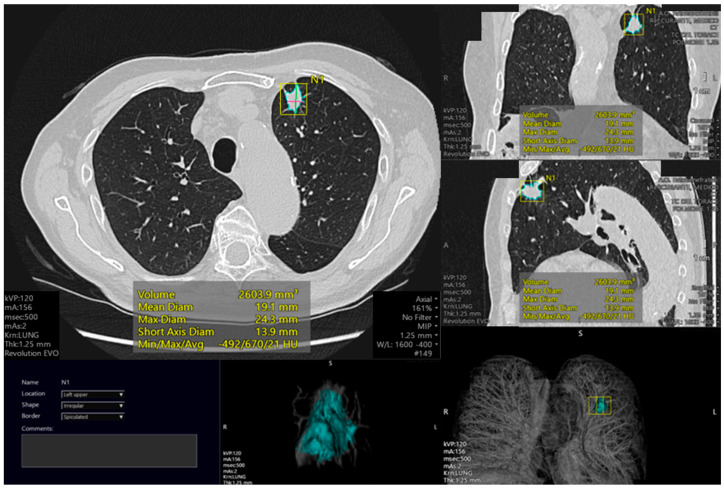
Figure 2.
Example of left upper lobe pulmonary lesion with automated analysis. The automated study permits to calculate different lesion parameters such as volume (mm3), mean diameter (mm), maximum diameter (mm), short axis diameter (mm), and density (Hounsfield Units). A circle mark surrounding the lung nodule is realized in the identified lesion in order to analyze it. Also, 3D reconstruction is shown.

