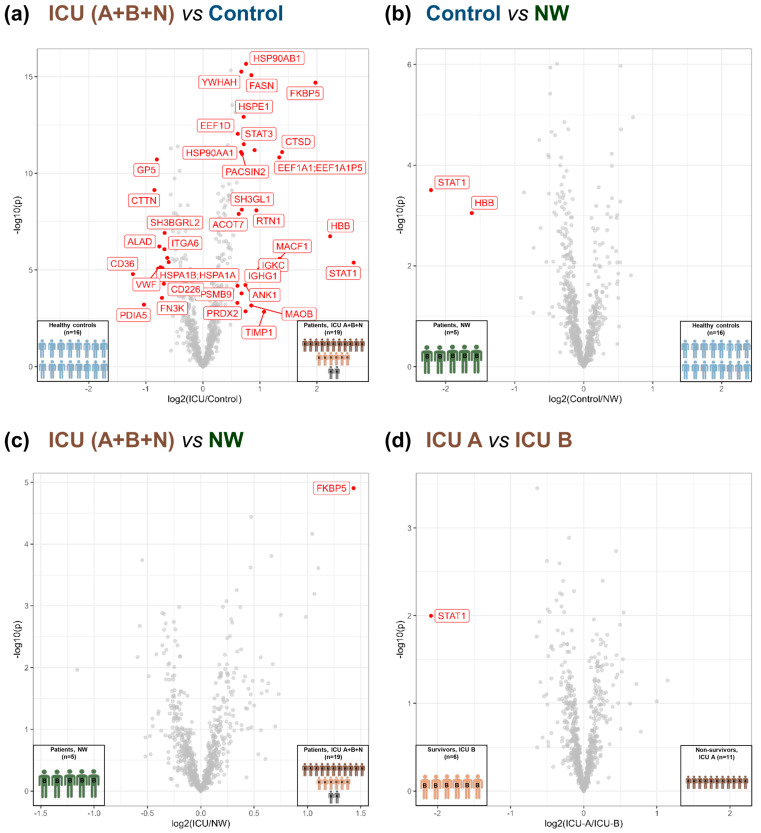
Figure 2.
Volcano plot of the different group comparisons. (a) ICU (A+B+N) vs. controls based on 723 PGs found in each sample. Of these, 38 were regulated significantly (FDR < 0.01, S0 = 2). (b) Control vs. NW based on 771 PGs found in each sample. Among these, two (STAT1 and HBB) were significantly different (FDR < 0.01, S0 = 2). (c) ICU (A+B+N) vs. NW based on 784 PGs found in each sample; one protein (FKBP5) was significantly different (FDR < 0.04, S0 = 1). (d) ICU A vs. ICU B based on 784 PGs found in each sample; one protein (STAT1) was significantly varied (FDR < 0.04, S0 = 1). ICU: intensive care unit (ICU A: non-survivors, ICU B: survivors, ICU N: unknown); NW: normal ward.

