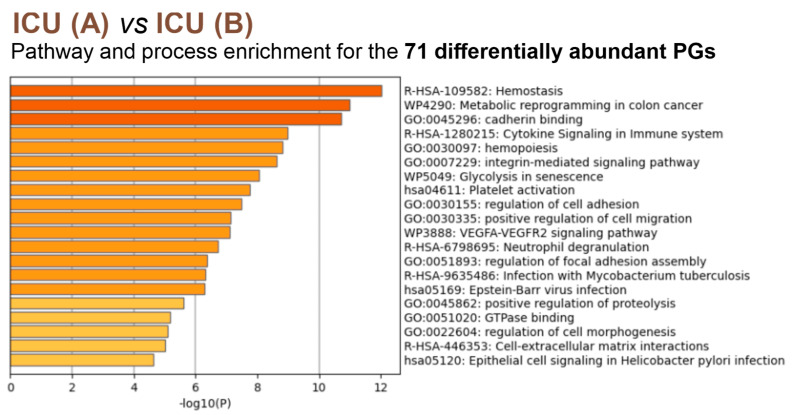
Figure 6.
The top 20 enriched biological processes across 71 differently abundant PGs (p < 0.05) from the comparison of ICU A vs. ICU B, colored by p-values (the darker the color, the more statistically significant). Each bar represents a statistically ranked enrichment term. Pathway and process analysis showed a clear correlation with hemostasis. In addition, changes in metabolism and cell adhesion were observed. ICU: intensive care unit (ICU A: non-survivors, ICU B: survivors, ICU N: unknown); NW: normal ward.

