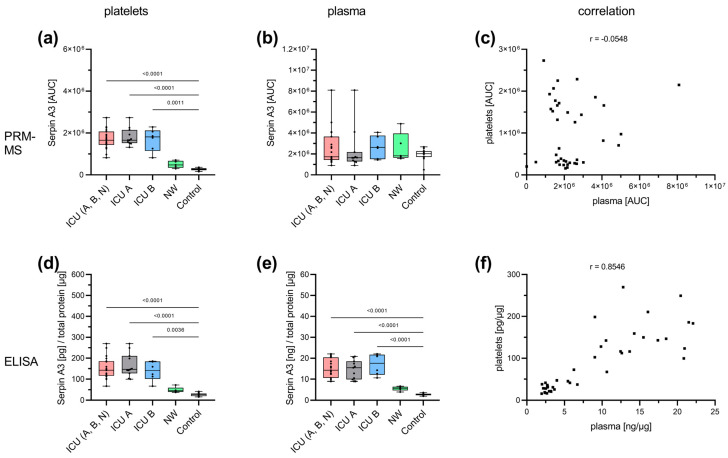
Figure A1.
Specific analysis of Serpin A3 by PRM-MS (top row) and ELISA (bottom row) in both platelets (a,d) and plasma (b,e). Serpin A3 showed the same regulatory pattern in all samples, with the exception of the plasma levels determined with PRM-MS (b). ICU patients presented the highest level, which was significantly higher compared with the controls. NW tended to have a slightly higher abundance compared with controls. Plasma levels determined with PRM-MS revealed no significant differences. A high correlation between platelet and plasma concentration was found with ELISA (p < 0.0001) (f) but not PRM-MS (p = 0.7371) (c). Platelet and plasma readings are presented as boxplots. Data were analyzed using the Kruskal–Wallis test followed by Dunn’s multiple comparison. The correlation was determined according to Spearman. ICU: intensive care unit (ICU A: non-survivors, ICU B: survivors, ICU N: unknown); NW: normal ward.

