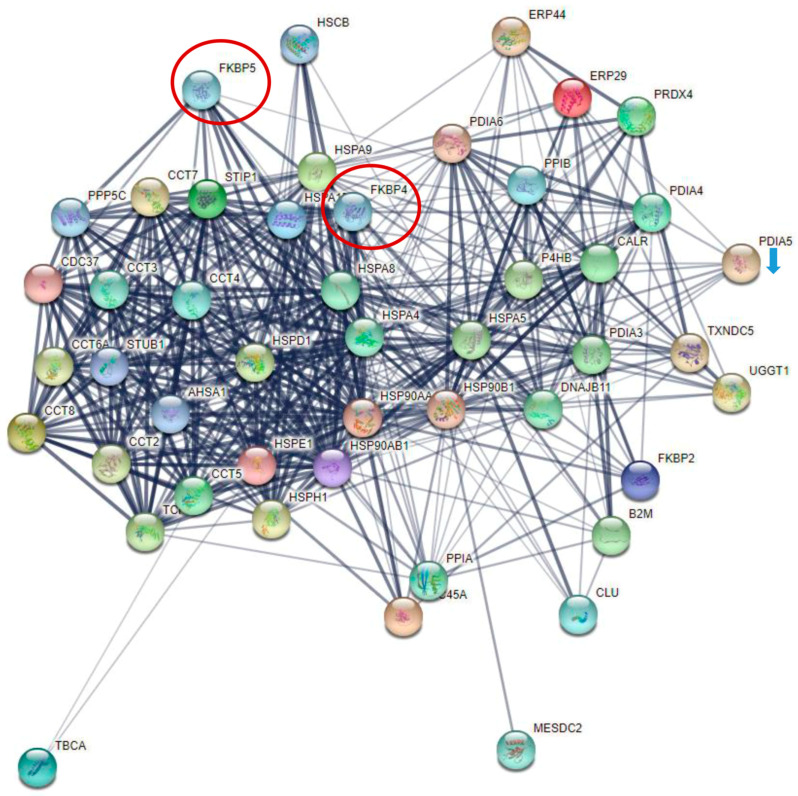
Figure A4.
Protein network associated with protein folding. Almost all proteins are upregulated in the patient group when comparing patients and controls. Only PDIA5 (blue arrow) shows downregulation. FKPB4 (red circle) is expressed exclusively in patient samples (ICU (A+B+N) and NW). FKBP5 (red circle) is among the proteins with the highest statistical significance and fold changes in the global proteomic analysis when comparing different groups.

