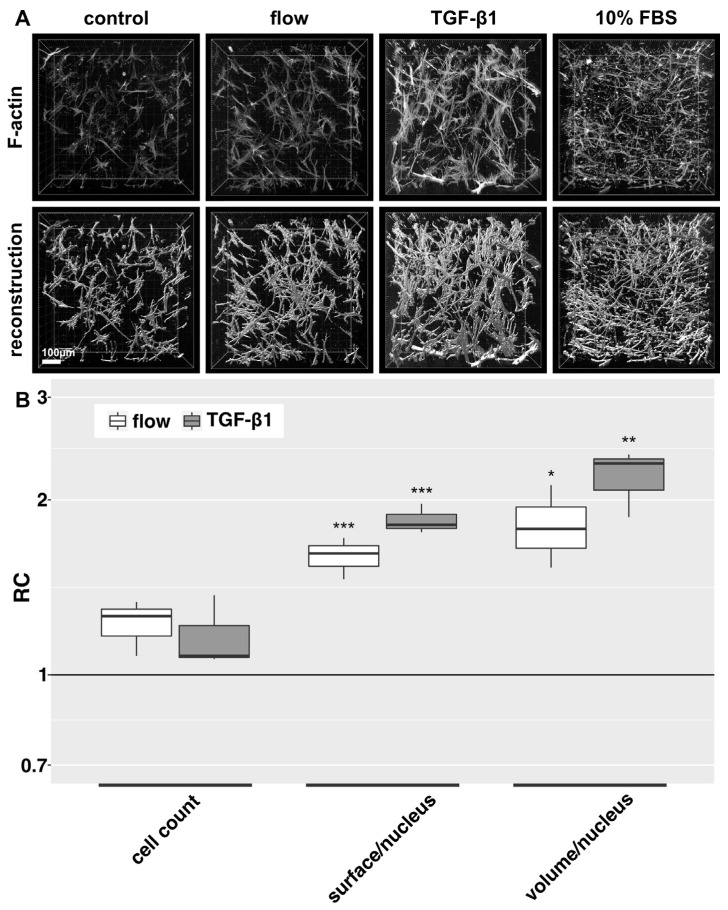
Figure 2.
F-actin cytoskeleton and 3D cell reconstructions of 3D HTF cultures exposed to slow fluid flow or control conditions for 72 h. HTF-populated collagen gels were exposed to either 0.2% FBS static medium (control), 666 µL/h flow (0.2% FBS), 10% FBS static medium or 5 ng/mL TGF-β1 (static, 0.2% FBS) for 72 h respectively. (A): Confocal image z-stack projections of F-actin stains are presented in the upper row. Three-dimensional reconstructions (lower row) of cell shapes were generated from z-stacks of F-actin stains using Imaris software. Image acquisition and representation are identical among different conditions. Three-dimensional reconstruction of 10% FBS was only performed for one experiment. (B). Relative change (RC) of cell count, surface/nucleus and volume/nucleus is displayed for flow and TGF-β1 stimulation. These data were calculated from the confocal image z-stack projections of Figure 2A. Asterisks indicate levels of significance in Dunnett’s t-test (* p < 0.05, ** p < 0.01, *** p < 0.001).

