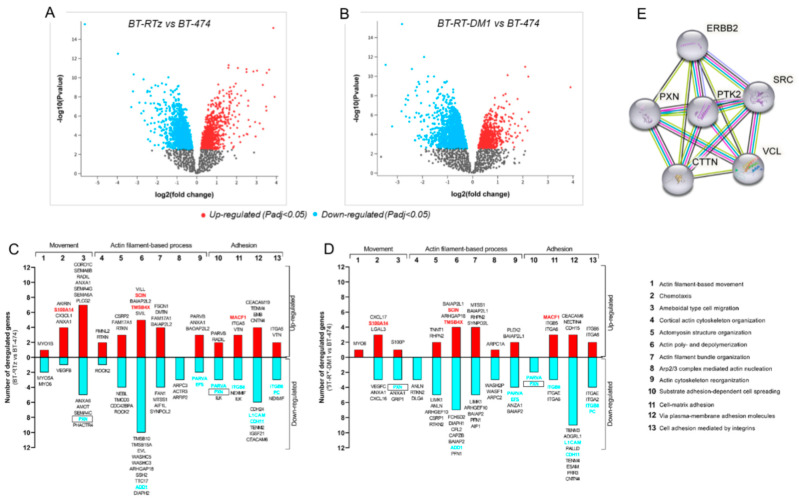
Figure 1.
Differential gene expression involved in the metastatic process in BC cells resistant to Tz or T-DM1. Differential gene expression volcano plots were obtained using AnalyzeGeo (https://www.ncbi.nlm.nih.gov/geo/geo2r/) (accessed on 25 May 2022) On the x-axis, the log2 fold change of (A) BT-RTz vs. BT-474, and (B) BT-RT-DM1 vs. BT-474. Genes upregulated (in red) or downregulated (in light blue) are shown (p < 0.05). Gray dots represent genes with no statistical significance. Gene ontology characterization by the PANTHER tool of genes downregulated or upregulated in (C) BT-RTz and (D) BT-RT-DM1 vs. control. The genes analyzed are those involved in different processes related to movement, adhesion, and metastasis. Red columns represent the number of upregulated genes, and light blue indicates the number of downregulated genes. Those genes that were equally deregulated in both resistant models are highlighted in red or blue. Deregulated genes simultaneously involved in two different processes in both resistant cell models are remarked in a rectangle. (E) The STRING tool was queried to establish paxillin interactors. Nodes represent proteins. Colored lines between the proteins indicate the type of interaction evidence used in predicting the associations. Red: fusion evidence; green: neighborhood evidence; blue: co-occurrence evidence; purple: experimental evidence; yellow: text-mining evidence; light blue: database evidence; black: co-expression evidence.

