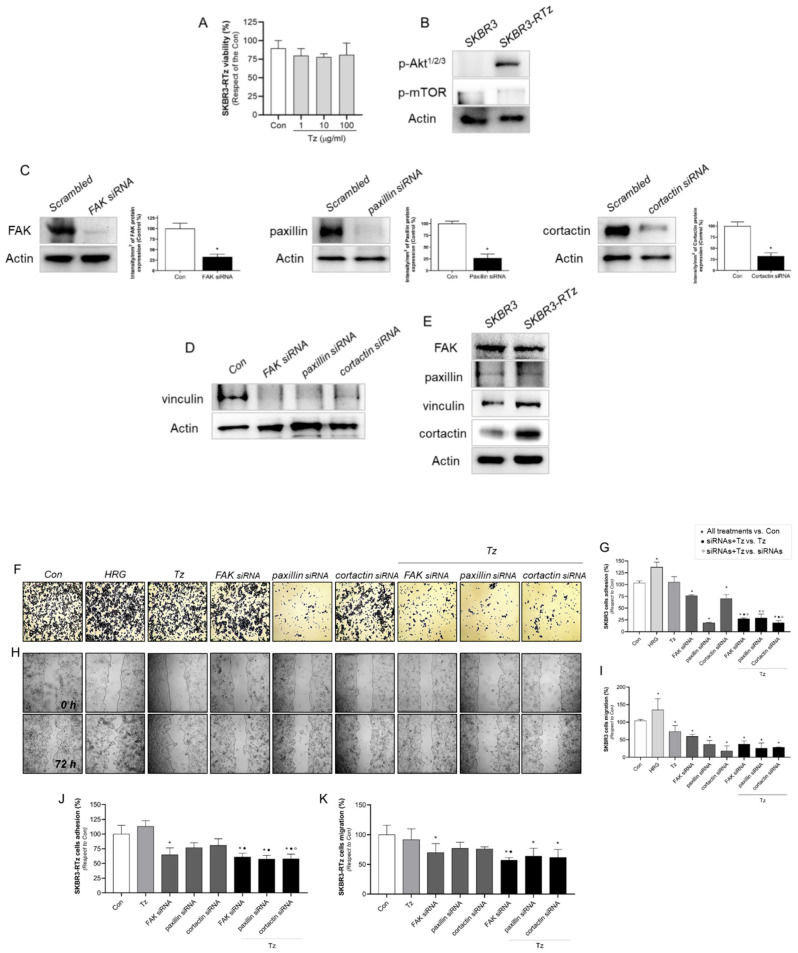
Figure 10.
Vinculin and cortactin used as predictive biomarkers for Tz-sensibility/resistance. (A) Cell resistance was evaluated by MTT assay in SKBR3-RTz BC cells. Cells were treated with increasing doses of Tz (1–100 μg/mL) for 72 h. The results are expressed as a percentage (%) of surviving cells compared to the control (Con, 100% survival). (B) Extracts of SKBR3 and SKBR3-RTz cells were lysated and the expression levels of phospho-AKT1/2/3 and phospho-mTOR were analyzed by wWstern blot. (C) Cells were transfected with specific siRNAs vs. FAK, paxillin, cortactin or siRNA control (Scrambled). The efficacy of gene silencing was assessed by Western blot assay. (D) Regulation of vinculin expression by FAK, paxillin and cortactin, after specific siRNAs treatment. (E) SKBR3 and SKBR3-RTz cells were lysated and FAK, paxillin, vinculin, and cortactin expression were analyzed by Western blot assay. Actin expression is shown as a loading control. SKBR3 and SKBR3-RTz BC cells were treated with HRG (1 nM), Tz (1 µg/mL), siRNAs vs. FAK/paxillin/cortactin, combined or not with Tz (1 μg/mL) for 72 h, and (F,G,J) cell adhesion and (H,I,K) migration assay was performed. Adhesion/migration results are expressed as a percentage of attached/migrated cells vs. control cells. Representative images and percentages of cells adhered and migrated are shown. * = comparison between all treatments vs. Con, • = comparison between siRNAs + Tz vs. Tz, and ° = comparison between siRNAs + Tz vs. siRNAs. p < 0.05 was considered statistically significant. All experiments were performed in triplicate.

