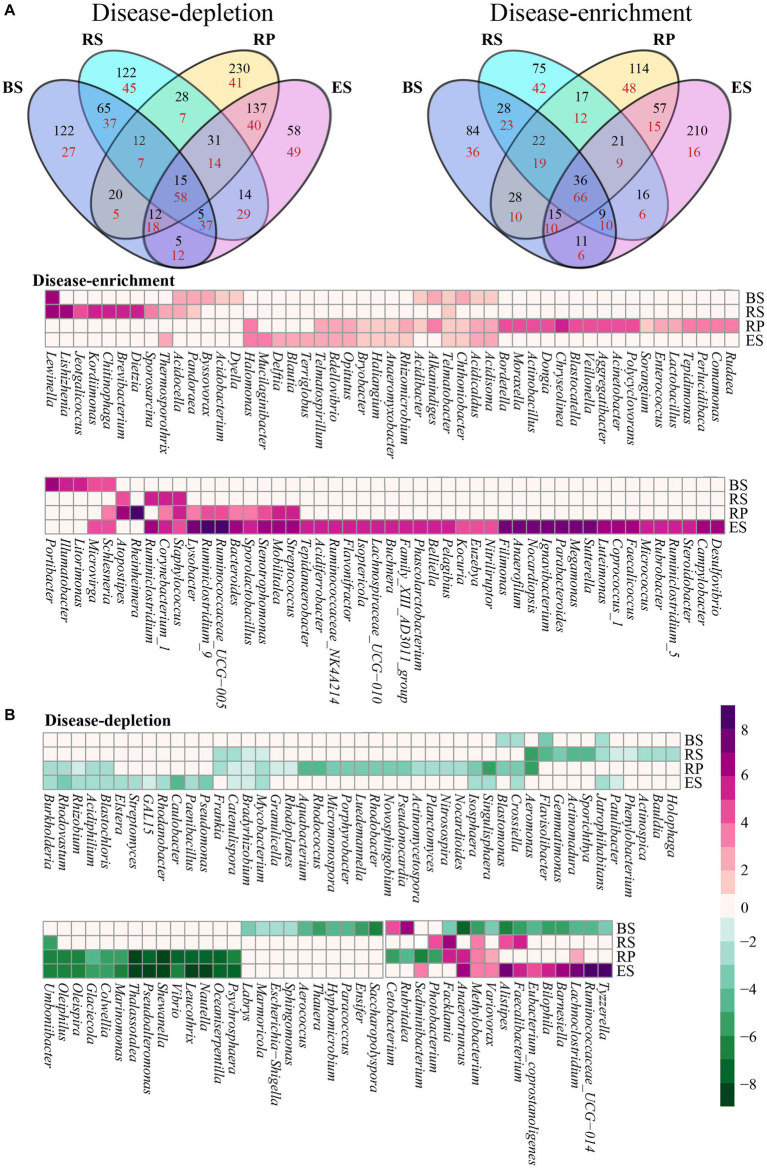
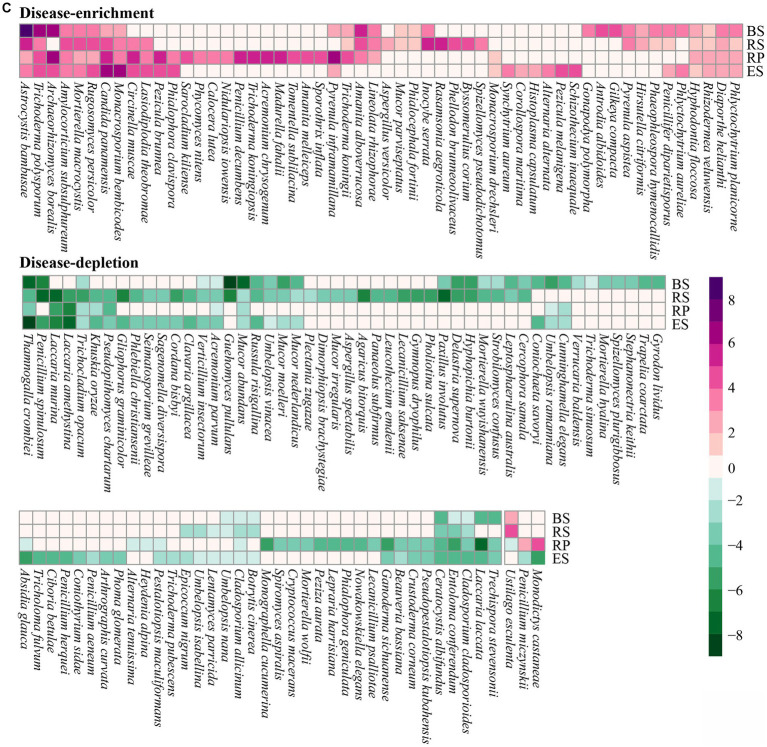
Figure 4.
Four niches microbial communities exhibited a distinct disease-response for root rot. (A) A Venn diagram comparing differentially disease-depleted and disease-enriched microbial OTUs in four niches. Disease-responsive bacterial (B) and fungi (C) taxa (p < 0.05) in each niches. The color of the cell indicated the log2 fold change in relative abundance between diseased and normal groups. An increase tend purple, while a decrease tend toward green. The plot displays a genus detected as significantly affected by root rot disease in at least one niches. BS: Bulk soil; RS: Rhizosphere; RP: Rhizoplane; ES: Endosphere.


