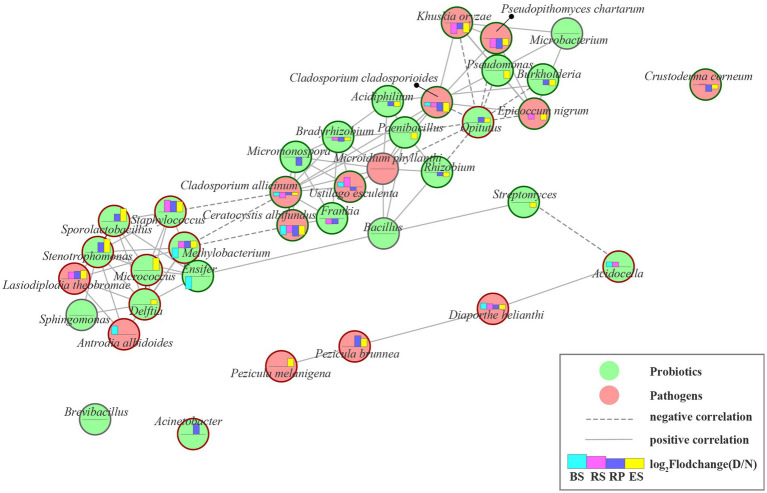
Figure 5.
The beneficial and pathogenic microbial interaction networks. Nodes represent individual beneficial or pathogenic microbe; edges represent significant Pearson correlation coefficient (r > 0.6, p < 0.001) between two microbes from normal to diseased plant in rhizocompartment. Edges length represent the magnitude of correlation coefficients (1-|r|). The longer the line, the smaller the correlation coefficients. Green circular ring indicate that the microbe strongly decreased under plant disease-stress, corresponding, red circular ring indicate increase. Moreover, gray circular ring indicated unchanged. Histograms displays the log2 fold change of genus relative abundances between diseased and normal groups. Column upward indicated the microbe significantly enriched in the diseased group. BS: Bulk soil; RS: Rhizosphere; RP: Rhizoplane; ES: Endosphere. N: normal samples; D: diseased samples.

